
US Housing Data Improve; ITB Breaks Out, Possible Breakout Retest N/T Will Be Telling
Over the past year, housing data – both survey- and activity-based – have gotten better. Housing starts and sales of new and existing homes have strengthened since the December 2018/January 2019 lows. ITB just broke out of two-year resistance. Possible retest will be telling.
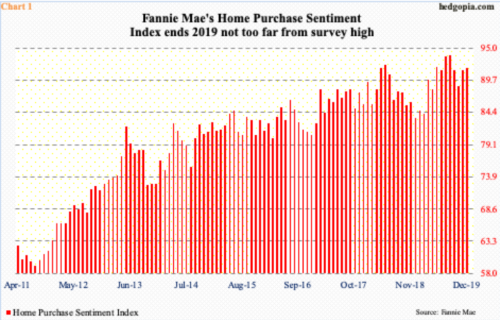
Fannie Mae puts out what it calls the Home Purchase Sentiment Index (HPSI). It is a monthly survey-based series and “is designed to track consumers’ housing-related attitudes, intentions, and perceptions.” It is fairly young. Data goes back to March 2011.
In December, the index edged up 0.2 points month-over-month to 91.7, which is not that far away from last August’s record high 93.8 (Chart 1). Since 2011, it has come a long way.
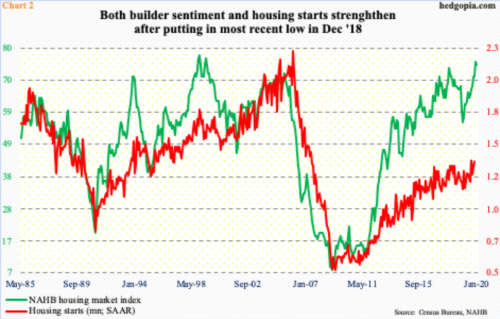
Right around that time, several other housing-related indicators bottomed. The NAHB Housing Market Index, which measures builder sentiment, hit 13 in June 2011 and never looked back (Chart 2). Its all-time low of eight was recorded in January 2009. This month, the index fell a point from December’s 76, which was the highest since June 1999. The all-time high of 78 was set in December 1998.
Housing starts, too, essentially went sideways for two years before putting in a durable bottom at 517,000 units (seasonally adjusted annual rate) in February 2011. In November, starts rose 3.2 percent m/m to 1.37 million, just behind last August’s cycle high 1.38 million.
Over the past year, builders have put money where their mouth is.
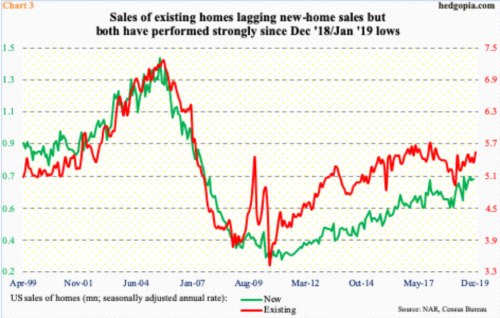
Monday, new home sales for December come out. In November, sales rose 1.3 percent m/m to 719,000 units (SAAR). The cycle-high 730,000 was hit last September. During the bubble, sales hit as high as 1.39 million units in July 2005. By February 2011, sales plummeted to 270,000 units. From that trough, sales have come a long way.
Ditto with existing homes. December sales were published Wednesday. They increased 3.6 percent m/m to 5.54 million units (SAAR). The cycle high 5.72 million was scored in November 2017. As did the new homes, the existing ones peaked in 2005 – in September at 7.26 million – then bottomed at 3.45 million in July 2010 (Chart 3).
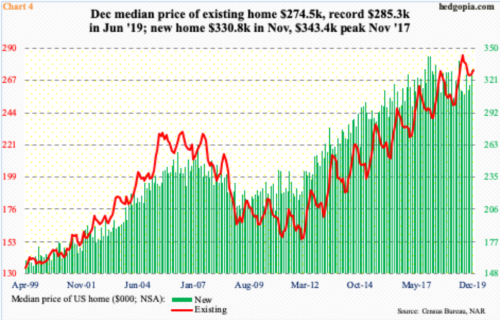
Sales have firmed up despite persistently rising prices. The median price of an existing home stood at $274,500 in December, within striking distance of record-high $285,300 from last June. Similarly, the median price of a new home peaked in November 2017 at $343,400, with last November at $330,800 (Chart 4). Inventory continues to be an issue, with supply of new homes at 6.3 months in November and of existing homes at three months in December. Another tailwind obviously comes from low mortgage rates.
Sales have improved, and that has given builders confidence. This is getting reflected in starts. At least judged by investor sentiment, this is expected to continue.
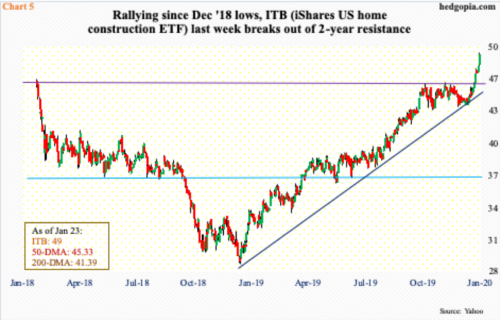
ITB (iShares US Home Construction ETF) last week broke out of two-year resistance just north of $46 (Chart 5). The ETF ($49) was started in May 2006 and it peaked in that very month at $50.10.
Momentum is very strong currently, but things are beginning to look stretched as well. The daily RSI closed Thursday at 82.3, with the weekly at 77.7 and the monthly at 72.5. Should the ETF begin to unwind the overbought condition, the significance of breakout retest at $46+ cannot be emphasized enough. Should a breach occur, there is trend-line support around $45 from December 2018. It is a must hold. Whether or not these levels hold will tell us a lot about where investors think US housing is headed in the months and quarters to come.


