
US Equities Roll Over On Earning Woes
The State of Affairs in Financial Markets
The narrative in financial markets is quickly evolving from a state of relative stability on lingering positives from an anticipated deal between the US and China on trade, towards the cruel reality of the cyclical macro risk-off trend established in US equities since last year. The disappointing earnings by Caterpillar and Nvidia, the former seen as a bellwether of the global industrial sector, comes to show that US companies were not immune to the Chinese trade tariffs.
Not only we see G10 economies, with the US the maximum expression, suffering from late economic and business cycles, but the Sino-US trade war has exacerbated, if anything, the underlying weakening trends in economies such as the European Union, the United States, and especially in China, with the domino effect expanding elsewhere. I focus on these three countries in particular as they account for most of the globally generated growth.
The temporary re-opening of the US government after a record-long shutdown should really be perceived as a short-term risk removal but far from acting as a catalyst to influence market movements for a protracted period of time, as clearly seen by the price action in equities on Monday.
The concurrent negative outlook in China by heavyweights such as Caterpillar, NVIDIA, Apple, and the list goes on, is the byproduct of an economy that is walking a tightrope with clear symptoms of a slowdown. There is an excessive reliance towards China, which is no surprise as the country has single-handedly orchestrated over ½ the global growth in the last decade.
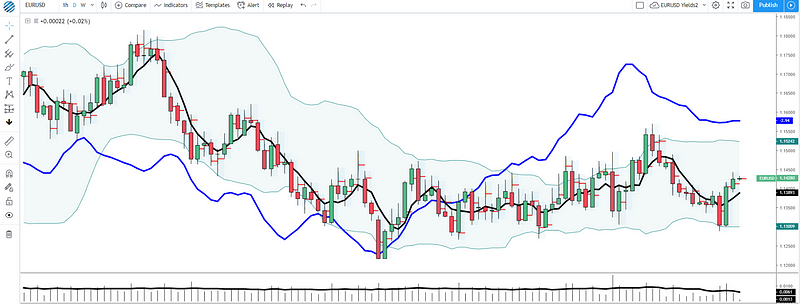
In FX, the USD continues to trade on the backfoot after an off the cuff massive sell-off last Friday, in which no single driver could be attributed. The Aussie and the Kiwi have been well supported in light of the weakness seen in the US Dollar. One currency that remains relatively cheap if risk-off were to pick up further is the Japanese Yen, which has corrected a decent portion of its Dec-Jan rally. Wherever equities go, the Yen crosses will most likely follow. The CAD traded offered as Oil came under pressure.
It’s the markets’ hope that through the course of this week, high-level talks between the US and China in Washington can yield positive outcomes for markets to latch on. If you think about it, there is a broad-based recognition by market forces, as manifested via the Oct-Dec sell-off in equities, that the global economy is in trouble as the G4 aggregated balance sheets shrink. This has immense repercussions as Central Bank have sadly become the ultimate liquidity providers in the system.
Striking a deal in the trade front with China won’t be easy, as the US keeps flexing its muscle to make sure their ambitious demands are met within a context of accountability and enforcement. However, alongside an eventual end to the current trade stand-off, what’s really going to move the needle to keep markets sustained is the anticipation that Central Banks will be the ultimate markets’ sugar daddy providing further stimulus when the proverbial hits the fan.
The PBOC has been forced to maintain its perpetual easing bias since the GFC with further stimulatory policy tweaks, the ECB has touched on the idea of readiness for further easing if needed, while talk is emerging that the Fed may end the normalization of its balance sheet (QT) earlier-than-expected. The 3 banks are the real elephants in the room where the fate of markets rests from a macro perspective.
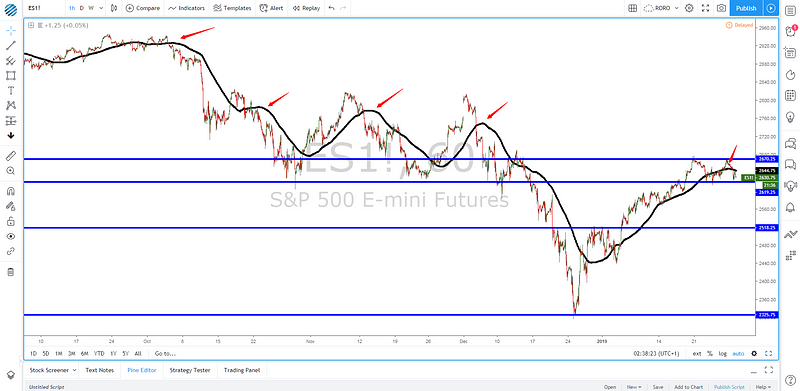
Talking about macro, it’s precisely the convergence of major cyclical forces originated back in October via the aggressive selling of the S&P 500 — proxy for global stocks — and the familiar spillovers we saw into credits, the Japanese Yen, etc, that we simply cannot ignore. Even if the start of the year has seen a short-term relief rally that may have ignited renewed hopes, one will be hard-pressed arguing that the rise in the stock index has inflicted sufficient technical damage to make a case for a change in the underlying macro risk-off tone. Too little in the grand scheme of things.
That’s precisely the reason why whenever we get a concurrence of signals all pointing for a resumption of the underlying bearish trend, we should listen. I am referring that after a month-long rally, we finally see the 5-day MA in the S&P 500 rolling over. Whenever that’s happened since the top from October last year, it’s certainly acted as an accurate pre-cursor.
The slope of the reliable 5-DMA in the US fixed income is not helping, as the dynamics are clearly in favor of sellers, even if in the short-term, a range has now been established. If we can find a resolution sub 3.03%, the US 30-year bond may find further technical demand towards 3%. Even as one shifts its focus to gold, the picture is analogous of an environment prone to feed risk-off flows as the metal exchanges hands above $1.3k even if mostly fueled by USD weakness for now.
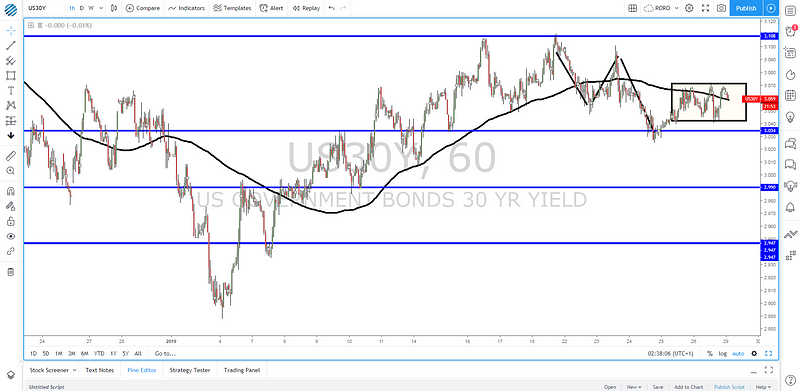
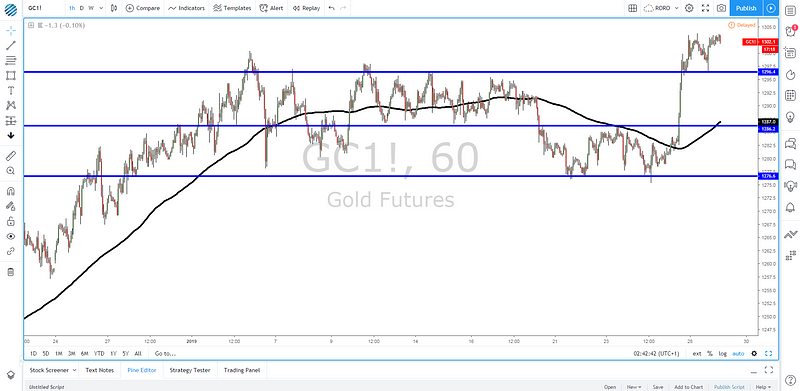
Chart Of The Day — XAU/AUD Ready For A Trend Resumption
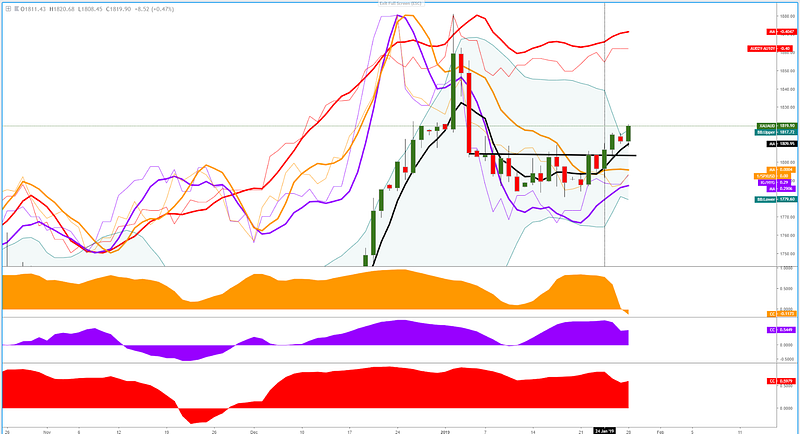
Gold/Aussie looks ready for a trend resumption. One could make a solid case from the black vertical line when a breakout materialized in line with the current cycle. You will notice that there is a concurrence in slopes via the 5-DMA in the IG/HYG ratio (negative signs in credit markets — in purple — ), inverted S&P 500 (orange line) or Aussie yield curve (red line), which continues to flatten and it indicates the risks are building up for the RBA to sounds more dovish. Bear in mind, all the added instruments exhibit very credible correlations with XAU/AUD as of late, strengthening the bullish case.
Important Footnotes
- Risk model: The fact that financial markets have become so intertwined and dynamic makes it essential to stay constantly in tune with market conditions and adapt to new environments. This prop model will assist you to gauge the context that you are trading so that you can significantly reduce the downside risks. To understand the principles applied in the assessment of this model, refer to the tutorial How to Unpack Risk Sentiment Profiles
- Cycles: Markets evolve in cycles followed by a period of distribution and/or accumulation. The weekly cycles are highlighted in red, blue refers to the daily, while the black lines represent the hourly cycles. To understand the principles applied in the assessment of cycles, refer to the tutorial How To Read Market Structures In Forex
- POC: It refers to the point of control. It represents the areas of most interest by trading volume and should act as walls of bids/offers that may result in price reversals. The volume profile analysis tracks trading activity over a specified time period at specified price levels. The study reveals the constant evolution of the market auction process. If you wish to find out more about the importance of the POC, refer to the tutorial How to Read Volume Profile Structures
- Tick Volume: Price updates activity provides great insights into the actual buy or sell-side commitment to be engaged into a specific directional movement. Studies validate that price updates (tick volume) are highly correlated to actual traded volume, with the correlation being very high, when looking at hourly data. If you wish to find out more about the importance tick volume, refer to the tutorial on Why Is Tick Volume Important To Monitor?
- Horizontal Support/Resistance: Unlike levels of dynamic support or resistance or more subjective measurements such as Fibonacci retracements, pivot points, trendlines, or other forms of reactive areas, the horizontal lines of support and resistance are universal concepts used by the majority of market participants. It, therefore, makes the areas the most widely followed and relevant to monitor. The Ultimate Guide To Identify Areas Of High Interest In Any Market
- Trendlines: Besides the horizontal lines, trendlines are helpful as a visual representation of the trend. The trendlines are drawn respecting a series of rules that determine the validation of a new cycle being created. Therefore, these trendline drawn in the chart hinge to a certain interpretation of market structures.
- Correlations: Each forex pair has a series of highly correlated assets to assess valuations. This type of study is called inter-market analysis and it involves scoping out anomalies in the ever-evolving global interconnectivity between equities, bonds, currencies, and commodities. If you would like to understand more about this concept, refer to the tutorial How Divergence In Correlated Assets Can Help You Add An Edge.
- Fundamentals: It’s important to highlight that the daily market outlook provided in this report is subject to the impact of the fundamental news. Any unexpected news may cause the price to behave erratically in the short term.
- Projection Targets: The usefulness of the 100% projection resides in the symmetry and harmonic relationships of market cycles. By drawing a 100% projection, you can anticipate the area in the chart where some type of pause and potential reversals in price is likely to occur, due to 1. The side in control of the cycle takes profits 2. Counter-trend positions are added by contrarian players 3. These are price points where limit orders are set by market-makers. You can find out more by reading the tutorial on The Magical 100% Fibonacci Projection
The Daily Edge is authored by Ivan Delgado, Head of Market Research at Global Prime. The purpose of this content is to provide an assessment of the market conditions. The report takes an in-depth ...
more

