
US Economic Growth Pushes Yields Higher
The biggest trend in markets is the US economy’s outperformance over emerging markets and other developed economies. The data keeps adding up and expanding into a pervasive trend. Japan was added to the list of economies with tepid economic growth which fell to -0.2% in Q1, down from +0.6% in the previous quarter. This ended two years of growth which was the longest streak of positive GDP growth in 28 years. Normally, this might have been chalked up to Japan having a momentary slip-up, but the overall trend of weakness in global growth outside of the US has made markets more nervous.
The best summary of this trend is seen in the U.S. dollar index which is up 5.12% in the past 3 months. The dollar rally is mostly caused by the economic data rather than the Fed raising rates because the Fed is actually following the market, not ahead of it, as we’ll review later in this article. The dollar rally is causing countless shifts in the market. For example, the Russell 2000 is now at a record high because small caps are domestic firms that focus on the domestic US consumer. They are using their profits which are in U.S. dollars to buy goods and raw materials from international markets. The other shift we’ll mention that’s caused by the strong dollar is the weakness in emerging markets. The emerging market equities are taking a big hit.
From their recent highs, Turkey is down 29%, Indonesia is down 22%, Brazil is down 21%, and Mexico is down 21%. The Bloomberg chart below shows the local currency emerging markets ETF is down from $7.9 billion to $6.5 billion since the start of April.
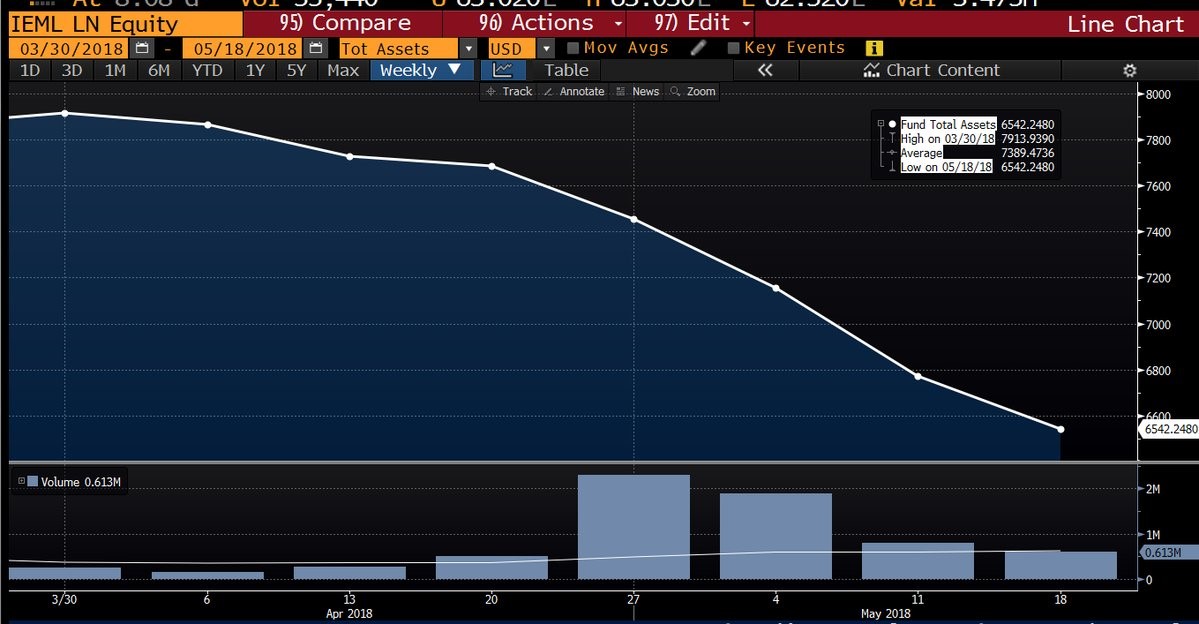
Source: Bloomberg
Emerging market debt is also selling off as the PowerShares Emerging Markets Sovereign Debt Index (PCY) is down 10.06% from September 8th. Emerging market corporations issued $450 billion in cheap dollar debt in 2017 which was a record; it’s now causing significant turmoil. Emerging market governments are also being hurt by the rising dollar even though they have lowered their account deficit from $91 billion in 2016 to $26 billion in 2017. They are also trying to limit the damage by using dollars to buy their local currencies, boosting their values.
Strong US Economic Data
Some of the hard data from April is still coming in. We’re looking at it closely as the first quarter’s 2.3% GDP growth was a deceleration. One of the most important data points last week was the industrial production report seen in the chart below created by Schwab. Production growth was 0.7% month over month which beat estimates for 0.6% growth. Manufacturing growth was 0.5% month over month which beat the estimate for 0.3% growth.
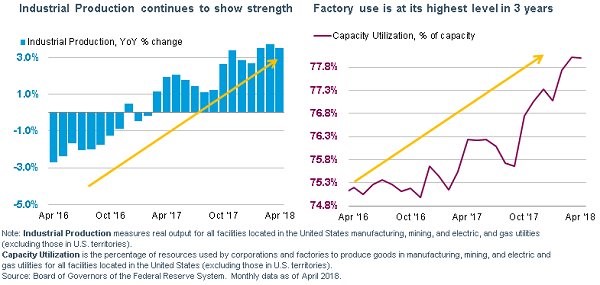
Source: Schwab
The chart on the right shows capacity to utilization rose from 77.6% to 78%. It’s still below the cycle peak of 79.6% in November 2014, signaling there’s still manufacturing slack left. The NY Fed Nowcast is similar to the Atlanta Fed’s model except it doesn’t have as severe volatility in data, which implies it’s more trustworthy during the quarter. The model pushed up its estimate for GDP growth to 3.2% as the industrial production report boosted it by 0.32% (0.14% from capacity utilization and 0.18% from industrial production).
Fed Actually Behind The Curve
We mentioned earlier in this article that the main reason the dollar is rallying, which is causing domestic small caps to rally and emerging markets to sell off, is the economic data. The Fed raising rates can push up the dollar as well, but the Fed is behind the market’s expectation for rate hikes. As you can see from the Bloomberg chart below, the probability of 4 or more hikes has surpassed the probability of 3 hikes in 2018.
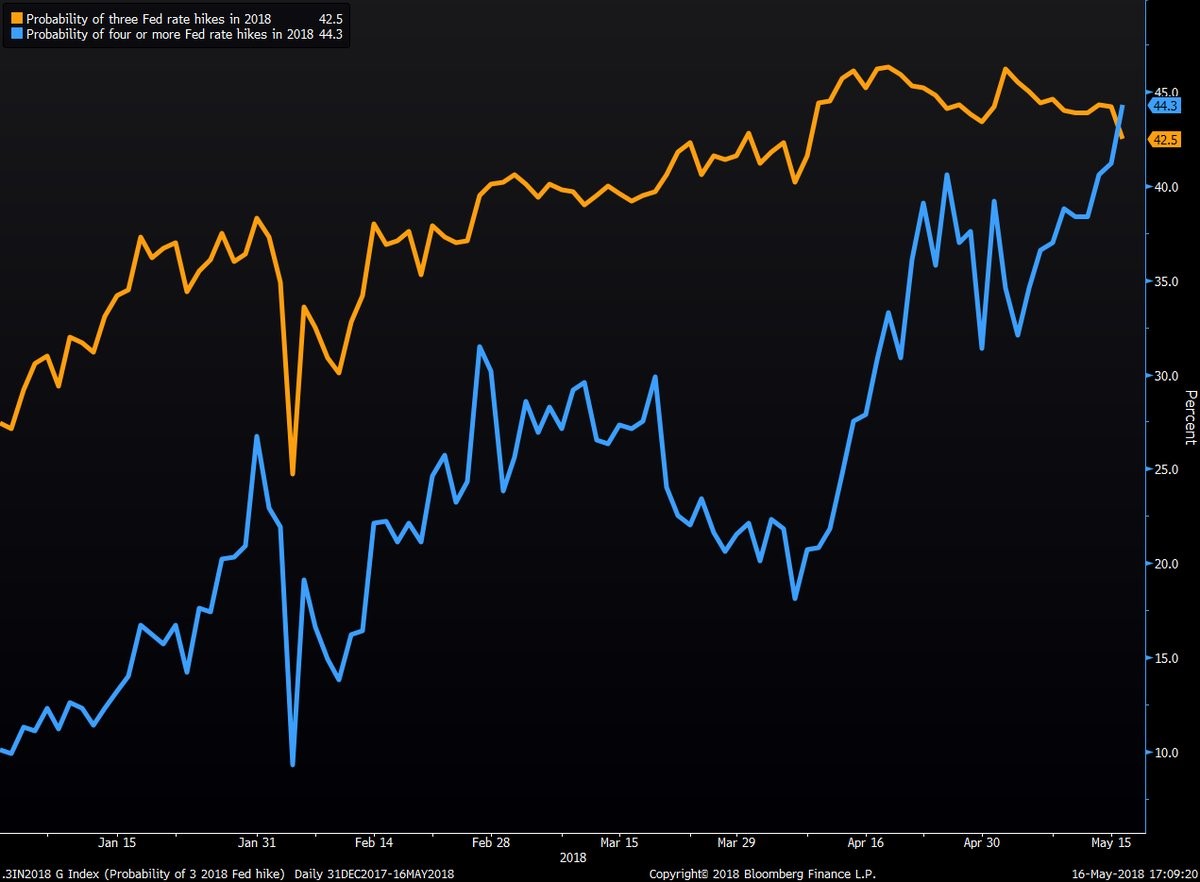
Source: Bloomberg
The Fed’s current guidance calls for 3 hikes which explains why we said they are behind the curve. For the stock market, the Fed being slow to hike rates is favorable as long as inflation stays tame which it has this year. Rate of change for inflation has vacillated, but year over year growth hasn’t surpassed the Fed’s 2% target yet.
US Rates Are Rising Versus International Markets
Besides the dollar, Treasury yields have also risen relative to other government bonds because US growth is outperforming other countries. The best part of the rise in the 10-year bond yield is it steepens the yield curve. The situation where the Fed is raising rates slowly despite strong growth prevents an inversion even as near maturity bond yields increase. The strong uptrend in U.S. Treasury yields is at a historically extreme point which has caused some to wonder if the trend is overdone. To be clear, trends reverse when the fundamentals change, not when runs get extreme. However, the historic signals can be a valid tip-off that the market has reached an extreme point.
The Bloomberg chart below is an example of an extreme point.
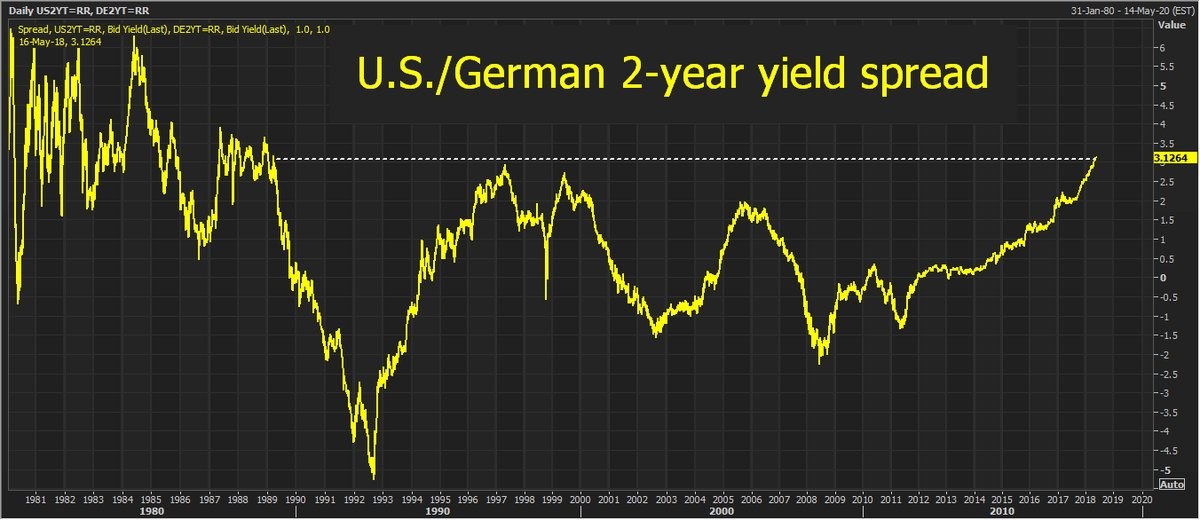
Source: Bloomberg
The spread between the U.S. and German 2 year bonds has reached the widest point since March 1989. The ECB’s bond-buying suppressing yields plays a part in the lower German yield, but the recent weakness in German yields is coming from economic performance. The quarter over quarter Q1 GDP growth was recently released as 0.3% which missed estimates for 0.4% and last quarter’s 0.6%. This was the lowest growth since Q3 2016.
European Weakness
We have noted some of the economic reports from Q1, while we mentioned the U.S. performance from April which implies improved growth in Q2. To remedy that situation, we have the chart below which verifies the improvement in the dollar and U.S. yields versus Europe. As you can see from the chart by Fulcrum Asset Management, the activity Nowcast has declined from above 3.5% back to the long run trend. These results are similar throughout the world except America, primarily.
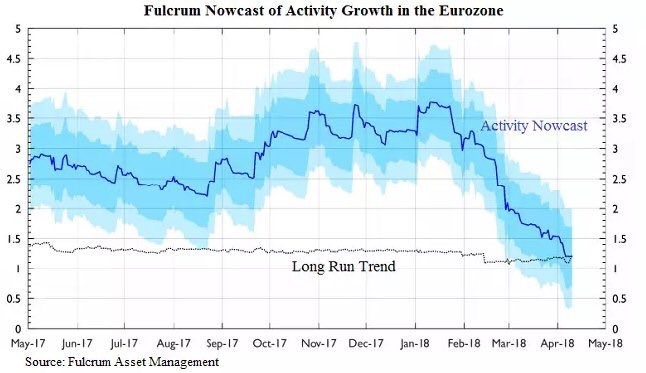
Source: Fulcrum Asset Management
US Yields Unusually High
US yields aren’t just high compared to Germany. The chart below from Bianco Research shows the US 10 year yield compared to a few other developed countries.
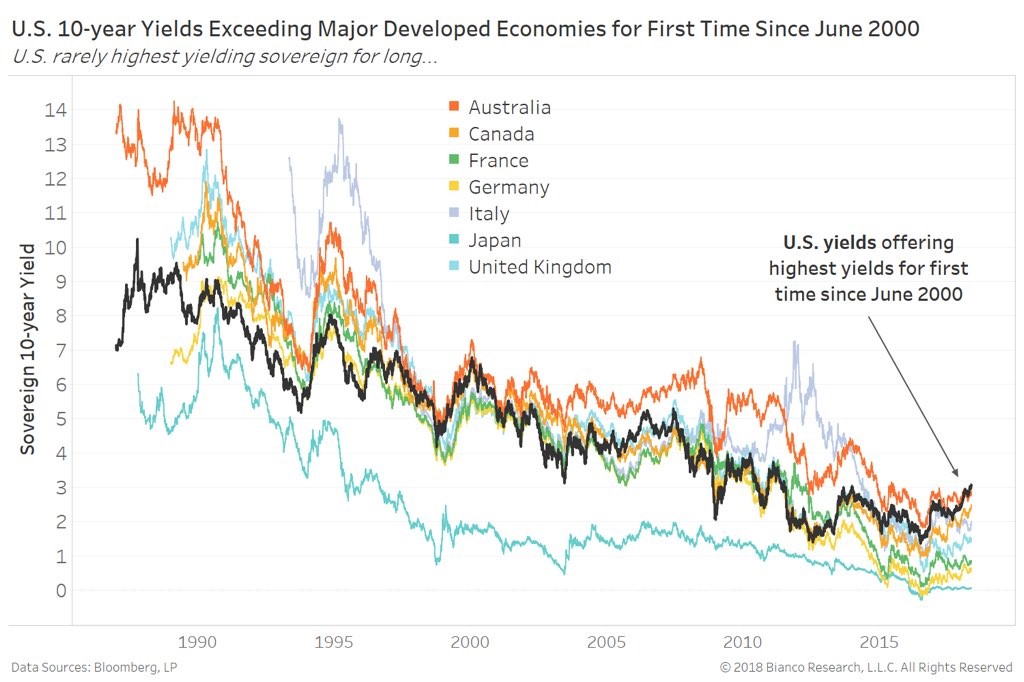
Source: Bianco Research
The 10 year U.S. Treasury yield is the highest for the first time since June 2000 when compared to other countries. It’s a very unusual time. If the 10-year U.S Treasury yield starts falling to be more in line with history, the U.S. curve could easily unwind, but we’d likely need a deceleration in growth for that to occur.
Conclusion
US growth is looking great in Q2 as the industrial production report supports the NY Fed’s estimate for 3.2% growth. The Empire State Manufacturing report and the Philly Fed Manufacturing report for May both beat the highest estimates which furthers the notion that the U.S. economy is on solid footing. This could keep the trends we discussed in this article in place in the short-term.
Disclaimer: Please familiarize yourself with our full disclaimer here.


