
US Dollar To Rain On Gold’s Parade
Summary
The USA is engaged in quantitative tightening while most other countries are still easing. This points to a stronger U.S. dollar.
Excess bank reserves held at the Fed should keep long-term rates lower for longer.
Actual Working Monetary Base AWMB should continue to rise keeping the U.S. economy expanding.
Unfortunately, the strong U.S. dollar should keep the U.S. price of gold subdued for some time.
Buying gold shares is only for patient Investors.
Think of Currencies as Commodities
Assuming nothing else changes, increasing the supply of any commodity, in this case, the U.S. dollar should result in its price falling. In the domestic market, this should result in lower short term interest rates while in the international market its exchange rate should fall. Contracting the supply of U.S dollars should have the opposite effect.
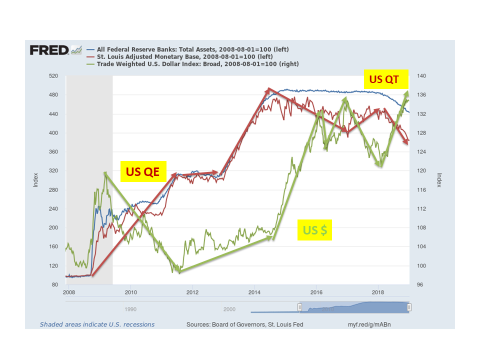
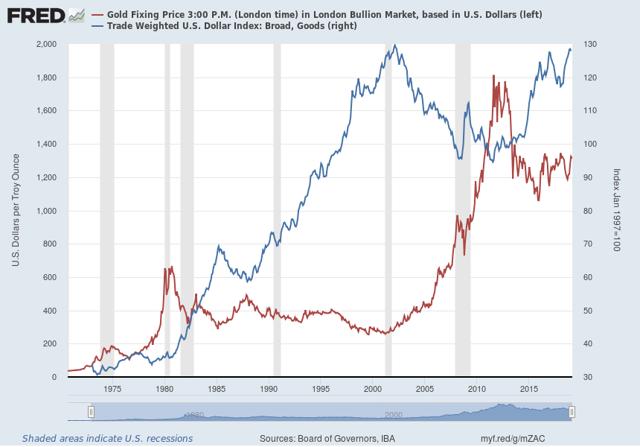
The general trend of the U.S. monetary base since Lehman was up until it peaked in August 2014. Thereafter, the contraction of the U.S. monetary base has resulted in a strengthening of the U.S. dollar, as should have been the case. Simultaneously, short-term interest rates have risen as the Fed moved pre-emptively against inflation.
(Click on image to enlarge)
The U.S. monetary base rose for six years post-Lehman and one might have expected the U.S. dollar to fall. However, it did not as changes were also taking place abroad which also had significant impacts on the U.S. exchange rate. Other countries implemented QEs of their own to stave off the possible impact of a global financial meltdown and threats of recession.
Impact of Changes in Euroland
Looking at just the Euro area as an example of central bank actions taken post-Lehman, the following chart shows the impact on the foreign exchange price of the U.S. dollar.
In the immediate aftermath of Lehman, the Troubled Asset Relief Program (TARP) was funded by a more than doubling of the U.S. monetary base, the red line in the chart below. However, the ECB also acted rapidly to help stabilize the world financial system, the blue line. During the early months following the Lehman crisis the U.S. dollar rose, the green line. This, stemmed possibly from a massive flight to safety.
(Click on image to enlarge)
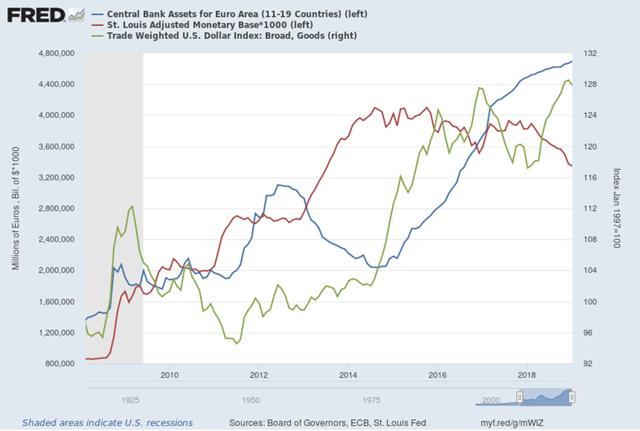
During 2009 the U.S. monetary base continued to rise while the ECB conducted a modest contraction. This gave rise to a decline in the U.S. dollar until the early part of 2010 when the ECB started to ease modestly while the U.S. monetary base fell modestly and the U.S. dollar strengthened.
By the start of 2011 U.S. QE was ramped up while the ECB tightened and miracle of miracles the U.S. dollar resumed its plunge. By the middle of that year, the U.S. monetary base stabilized when the Euro crisis hit. The ECB started to ease aggressively. More Euros and a constant U.S. monetary base through the end of 2012 gave rise to a moderately higher U.S. dollar.
Between mid-2012 and mid-2014 the ECB tightened while the U.S. monetary base grew substantially. This should have resulted in a falling U.S. dollar, which it did not. It must be remembered, however, that there are other moving parts in the equation such as monetary movements in the U.K., Japan, China, and others, which may explain the failure of the U.S. dollar to fall during that period.
From the summer of 2014, to-date the ECB has been easing while the U.S. monetary base has been level to falling and the U.S. dollar has been generally rising except in 2017 when the U.S. monetary base rebounded modestly and the U.S. dollar eased.
Fed Reduces Balance Sheet
Throughout the past year, the U.S. monetary base and the Fed Balance sheet have been contracting while the ECB has continued to ease causing the U.S. dollar to strengthen. While the ECB has talked about ending its QE, the U.S. monetary base and the Fed’s balance sheet are set to continue their declines. This QT could well push the U.S. dollar higher until the ECB itself starts to contract its assets, which may take some time given the weakening of the Euro area economies and the possible impact of Brexit.
A continuation of European QE combined with U.S. QT should result not only in a higher dollar but also imported disinflation. While this would be good for U.S. domestic inflation, it appears that both the U.S. government and the U.S. multinationals are not in favor of a much stronger dollar. Thus the Fed could well hold off any further increase in the Funds rate until the ECB begins to tighten, an unlikely event for at least a couple of years. Furthermore, one must also consider the impact of a falling Chinese currency.
Fed has New Levers to Pull post-Lehman.
To offset the impact of the 2008 financial crisis that stemmed from the collapse of the sub-prime mortgage bubble of the preceding three years the Fed expanded rapidly the U.S. monetary base to re-liquefy the banking system. This continued until 2014 with most of the increase ending up as excess bank reserves held at the Fed.
(Click on image to enlarge)
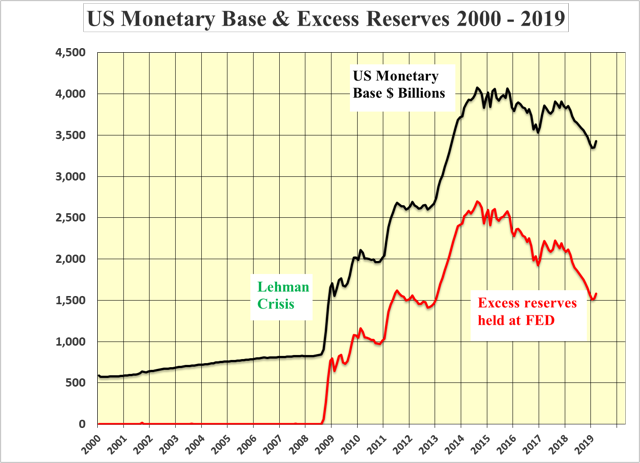
For the first time in late 2008, the Fed paid interest on the excess reserves (IOER) which helped the banks rebuild their balance sheets and keep their executives in the bonuses and lifestyles to which they believed they were entitled. This together with fear, increases in reserve requirements and new regulations that stifled borrowing, all coalesced to delay the impact of the increase monetary base moving through to the real economy. This resulted in a very slow recovery from the great recession.
At its peak in August 2014, the U.S. monetary base stood at $4.1 trillion of which the excess reserves amounted to $2.7 trillion. The impact of 6 years of QE was essentially sterilized by the Fed. In August 2008 just prior to Lehman the U.S. monetary base stood at $0.84 trillion and the excess reserves amounted to a minute $2.0 billion. By August 2016 the monetary base had increased 5 fold to $4.1 trillion while the excess reserves increased to $2.7 trillion. The amount of the monetary base at work in the economy rose by only $0.5 trillion from $0.84 trillion to 1.4 trillion.
Actual Working Monetary Base. AWMB
The amount of the monetary base actually at work in the real economy is calculated by subtracting the excess reserves from the total monetary base. This is shown in the next chart as the red line and denoted as the Actual Working Monetary Base (AWMB). The much more moderate growth of the AWMB along with changing regulations and fear would seem to explain the slow pace of economic growth post-Lehman.
(Click on image to enlarge)
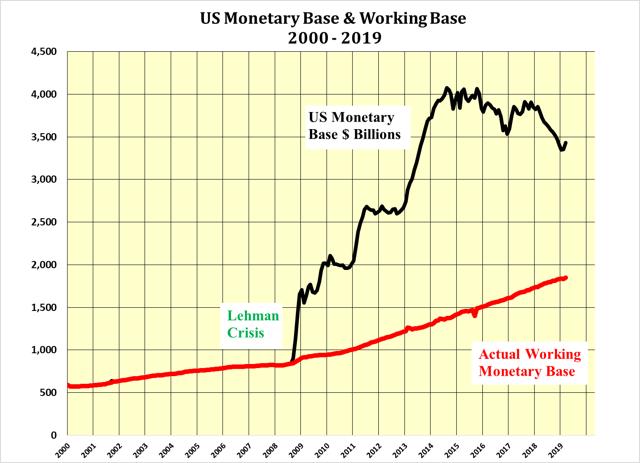
The lagging GDP performance compared to the total rise in the US Monetary base can be attributed to the failure of the commercial banks to push the money out into the real economy. Whether this is the result of fear, the changes in bank regulations or ultra-conservatism it is not known. However, the result of holding unprecedented amounts of reserves at the Fed has stymied the rate and magnitude of GDP recovery that might otherwise have been the case had the entire monetary base been allowed to pass through to the real economy.
Overall Quantitative Contraction Underway but not AWMB
The $O.645 trillion or 16% decline in the total monetary base from its peak has been quantitative tightening by the Fed, with all the ramifications of a pending recession. However, such an interpretation seems misguided as the GDP has responded only to the continued expansion of the AWMB.
The Fed does not have the control over the Funds rate that it used to have as the excess reserves the commercial banks have reduced the need for overnight funds compared to pre-Lehman. However, the Fed can now control the amount of excess reserves the commercial banks hold at the Fed by either increasing or decreasing the IOER. The former to slow down or reverse the growth of the AWMB and the latter to speed it up.
There remains almost $1.6 trillion in excess reserves for the Fed to use its new lever to speed up or slow down the growth in the AWMB. Such an option was not available prior to Lehman.
Much Room for AWMB to Expand even as Total Monetary Base Contracts.
The excess reserves held at the Fed stand at US$1.6 trillion so there is certainly a great deal of room for both the total monetary base of US$ 3.4 trillion to decline and the AWMB of US$1.8 trillion to rise. This should provide fuel for continued expansion of the US GDP at a pace in concert with the growth in the AWMB. Simultaneously, the contraction of the total monetary base should hold inflation in check but push the U.S. dollar higher.
Likely Outcome - Strong U.S. Dollar and Lower Rates for Longer.
Unfortunately, QT is taking place in the United States while QE is taking place elsewhere. This suggests strongly that the US dollar should strengthen relative to other currencies. While this would be negative for commodities priced in U.S. dollars, it should mean that the US bond market will attract yield-seeking international investors and momentum-following, domestic market participants.
Gold – the outlook is becoming clearer.
Unfortunately, a stronger U.S. dollar should put a lid on the U.S. dollar price of gold despite the wishes of the gold Bugs for a runaway price. According to Chairman Powell, the reduction of the Fed’s balance sheet is on autopilot. Thus it could be quite a while before there is an opportunity for the U.S. dollar gold price to rise to where the fundamentals suggest it should be.
(Click on image to enlarge)
Gold has risen in foreign currencies, or rather they have fallen in relation to gold. This holds true for most currencies from Australia and Canada to Venezuela and Zimbabwe.
It was previously thought that the U.S. dollar price of gold would rise in line with the AWMB. While this may happen eventually it is unlikely to do so until the Euro QE turns into QT at a faster rate than US QT.
(Click on image to enlarge)
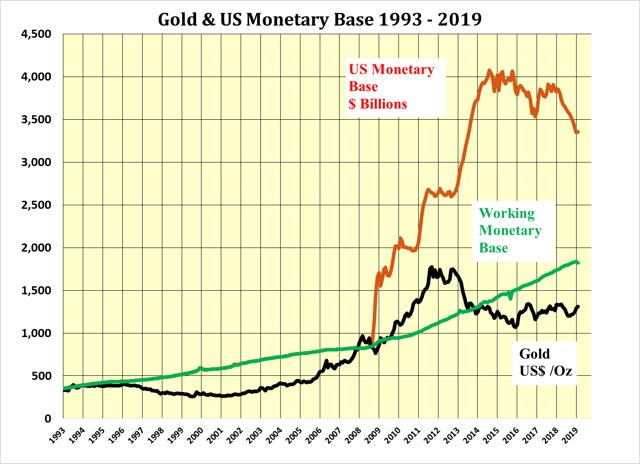
Post Lehman when the U.S. monetary base exploded on the upside with TARP and the subsequent QE, it made a great deal of sense to expect the gold price to track the monetary base into the stratosphere. This together with massive short covering culminated in the bullion price exceeding US$1,900 per ounce in 2011. Thereafter, its subsequent decline was puzzling as QE continued for another three years.
However, it was only after recognizing that much of QE had been sterilized by the huge buildup of excess reserves at the Fed that it made sense for the price of gold to have reverted to the path of the AWMD. It was the recognition of this change that led to the tempering of enthusiasm for a runaway gold price.
In 2015, the price of gold was projected to recover to the US$1,400 level by 2016, tracking the AWMB. This was almost achieved on a daily basis but its advanced was tempered by the strength of the U.S. dollar in 2017 and 2018 as later anticipated.
Following the same argument and with the AWMB now standing at $1.84 trillion, an equilibrium price for gold should be approximately $1,840 per ounce, all other things being equal. However, as the total U.S. monetary base is falling and the U.S. dollar is strengthening it seems likely that any significant gold price advance will remain tempered until it is fully recognized that the AWMB is the important vector to watch and this should continue to rise as excess reserves are moved into the real economy.
Buying Gold Shares is only for Patient Investors
- If one believes in gold’s recovery, eventually or otherwise, and one has patience, buy shares of companies that have the following attributes.
- Located in a safe Jurisdiction. (Wherever that might be these days!)
- In production
- High level of free cash flow.
- Low AISC
- Reserves of 10 years or greater.
- Selling at a discount to its 10% DCF
- Plans to expand production with construction underway.
- Highly prospective exploration brownfield properties or the same nearby to maintain and expand reserves as mines deplete
- Cash in the bank to explore and expand
- Good focused management.
- Paying a dividend to pay for patience.
Disclosure: I have no positions in any stocks mentioned, and no plans to initiate any positions within the next 72 hours.
I wrote this article myself, and it expresses my own opinions. I am not ...
more

