
US Dollar Techs, Fundamentals At Odds; Important Day For Gold
The US Dollar (via the DXY Index) has seen a rocky Thursday, trading higher through most of the Asian and European sessions before turning lower after stock trading opened up in New York. Weak economic data from during the US government shutdown period has traders questioning whether or not Q1’19 US GDP figures will hold up following the worst retail sales figures in nine years and a rise in jobless claims.
Although there are some questions over the reliability of the US economic data this morning – the figures don’t necessarily line up with similar data for the same reporting periods – the fact that consumption trends were so depressed has proven enough to get traders to question that narrative that ‘the shutdown was inconsequential.’ The first batch of Q4’18 US GDP figures are due out on February 28.
‘ROUND AND ‘ROUND THE CYCLE WE GO
It feels like this story is on repeat. The US-China trade negotiations appear to have hit another snag, which is not surprising, to say the least; it’s just another run through the trade war cycle that’s been on rinse-and-repeat for the past year. As we’ve discussed, the cycle goes: (1) Trump administration is tough on China; (2) financial markets sell off on trade war concerns; (3) Trump administration hints at US-China trade deal; (4) financial markets rally on trade deal hopes; (5) No deal materializes.
Earlier this week we ran through stage 2 (a meeting between US President Donald Trump and Chinese President Xi Jinping won’t take place before the March 2 deadline), stage 3 (the Trump administration hints at extended the window of no tariff implementation), and stage 4 (financial markets rally). We’re back to stage 5, with the new impasse. In the next few days, downtrodden rhetoric from the Trump administration should morph to something more hopeful.
GOLD PRICE CHART: DAILY TIMEFRAME (DECEMBER 2017 TO FEBRUARY 2019) (CHART 1)
(Click on image to enlarge)
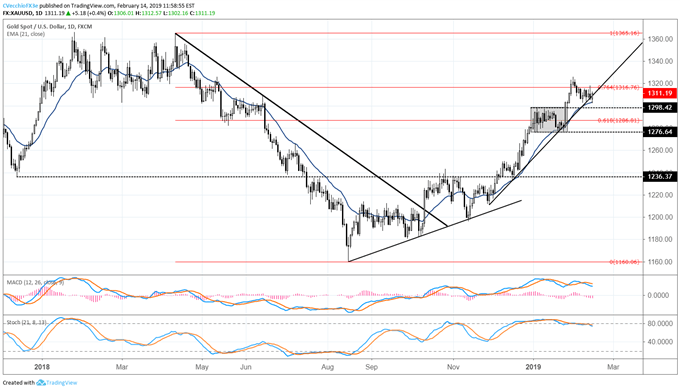
For the first time since January 15, Gold prices have retested their daily 21-EMA as support. The daily 21-EMA has held up (no closes below) since November 28, 2018; accordingly, until such an event transpires, there’s little reason to think that price action in February has been anything other than corrective in nature. Similarly, for the bulls to be reinvigorated with confidences, Gold prices will need to clear out Wednesday’s inverted hammer high at 1318.02.
DXY INDEX PRICE CHART: DAILY TIMEFRAME (JUNE 2018 TO FEBRUARY 2019) (CHART 2)
(Click on image to enlarge)
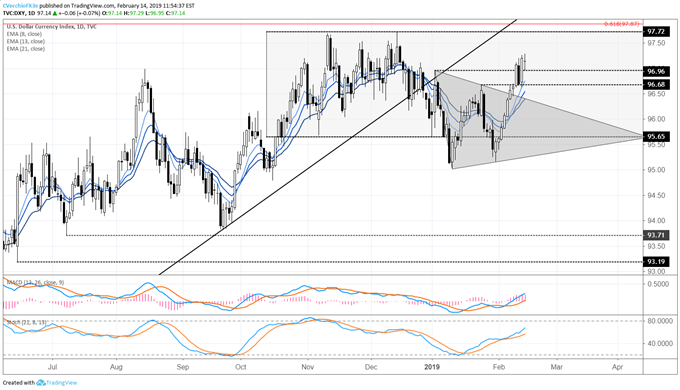
The DXY Index’s technical structure is bullish, despite the doji candle forming today. Following the symmetrical triangle breakout, price has cleared the January 2019 swing high at 96.96, pushing to a fresh yearly high. The bullish outside engulfing bar formed yesterday came after the first retest of the daily 8-EMA since February 5. Our outlook still holds that “an ultimate return back to the October 2018-January 2019 range highs near 97.72” is eyed.


