
US Dollar Supply As Risk Appetite Fully Re-Ignited
Quick Take
The narrative continues to be dominated by optimism around the US-China trade talks. At the same time, the divergence in US stocks (soaring) and long-dated global yields (depressed) is hard to be justified on the basis of ‘rainbows’ in the US-China trade discussions alone. One must also assume that the market is pricing quite aggressively the chances that Central Banks — the ECB, the Fed, and the PBOC — , will keep base money (QE) at very ample levels. The market is essentially giving the benefit of the doubt to the favorable resolution of two critical macro issues. Firstly, the US-China trade talks will ultimately yield a breakthrough that enhances the outlook for global growth into Q2 ’19. Secondly, the brief period of QT (Quantitative Tightening) is coming to an abrupt end. Central Banks are literally trapped in a QE vicious cycle. Pull this liquidity out of the system, and the ramification for financial conditions are more disastrous than the US, EU, China can bear. The current backdrop of rising equities and a falling US Dollar (microflows related for now) has allowed the likes of the beta currencies (NZD, CAD, AUD) to fare way better, with the outlook favorable as the intermarket flows stand. The outlook for the EUR, GBP has also improved, but unlike beta FX, these two currencies face a harder road ahead to sustain and/or extend much further its gains.
Narrative In Financial Markets
- It’s set to be a low key affair in markets during the North American session this Monday, as the US and Canada are both off to celebrate President’s Day and Family Day respectively.
- A new wave of ‘risk-on’ sentiment emboldens beta currencies and equities while the US Dollar starts to show a weakening macro bullish trend as optimism around US-China trade talks maintained.
- ECB members Villeroy and Coeure mull the possibility of a new LTRO (long-term refinancing operation) program for European banks should the weakening trend in European indicators continue. If confirmed down the road, it will invalidate any case for the ECB to consider any prospects of rate hikes during this year, which at this point, looks extremely unlikely.
- San Francisco’s Fed member Daily sees no case for further rate hikes this year while Atlanta’s Fed member Bostic says rates are a bit short of neutral but in no rush to move policy.
- The rhetoric surrounding the Sino-US trade talks keeps improving. US President Trump said there is a possibility to extend the March 1st tariff increase deadline if talks move in the right direction. Trump also boasted that “trade talks are going extremely well”, obviously doing its part to keep stocks pumped. Meanwhile, Xinhua news agency revealed that US and China reached a consensus on core unresolved trade issues. Trade negotiations are set to continue in Washington this week.
- The US has averted another government shutdown after US President declared a national emergency situation on the contentious issue of the border. Trump will now be able to release over $8b from various ministerial budgets for the wall funding.
- Bittersweet US data. On the positive side, the US Feb prelim Univ Michigan consumer sentiment rose by over 2bp to 95.5, even if inflation expectations in 5–10y drop markedly. It was encouraging to see to US empire index for Feb at 8.8 vs 7.00. The bad news was the sharpest decline in over 1y in US Jan industrial production to -0.6%, with the US an import price index of -0.5% adding to the negative mix (no inflation to be found).
- China’s data dump over the weekend (money supply, new yuan loans, aggregate financing volumes) shows a strong start of the new Chinese year as one would expect.
Potential Drivers — Economic Calendar Week Ahead
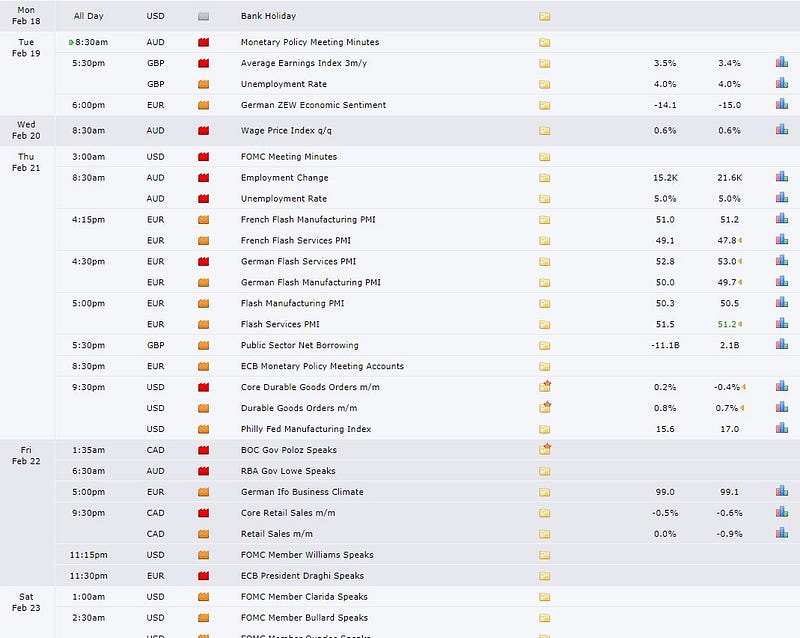
Source: Forexfactory
The calendar is absent of any relevant economic news releases on Monday.
On Tuesday, the focus will shift towards the RBA minutes of its Jan meeting, UK employment numbers and the German ZEW economic sentiment, the latter being a critical piece of information to take the pulse of the EU economic state. On Wednesday, all the attention will transition towards the Fed’s Jan meeting minutes. Earlier on the day, Australian will release wage growth numbers which are not a market mover for the AUD.
On Thursday, traders will be faced with the Australian jobs, plenty of EU PMIs alongside the ECB Jan meeting minutes will be released. The same day, the US will publish its core durable goods orders series as well as the Philly Fed manuf index. Later on Thursday, BOC Governor Poloz is scheduled to speak about monetary policy at the Chamber of Commerce in Montreal.
On Friday, RBA Governor Lowe is set to testify before the House of Representatives in Australia, the German IFO business climate will be released, which is even more important to watch than the ZEW series. In Canada, we will get retail sales data, while later on the day a raft of Fed speakers will speak alongside a scheduled appearance by ECB Draghi.
RORO Model: Risk-On Risk-Off Conditions
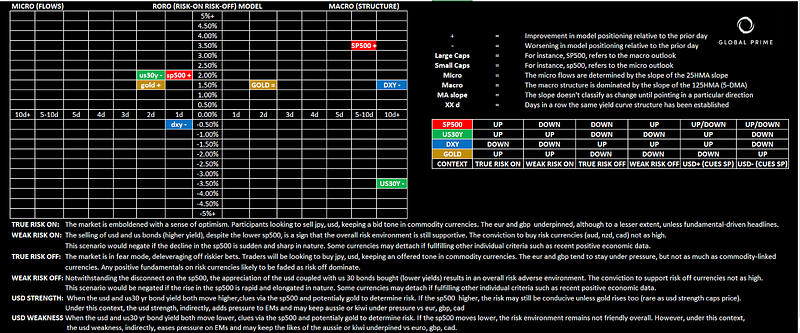
The market has entered, from a microflows standpoint, a context of USD weakness with equities on the rise. The downside pressure in the USD tends to ease pressure on emerging markets and allows beta currencies (AUD, CAD, NZD) to be underpinned as proxies. In this environment, risk sentiment is by and large dictated by the behavior in stocks, which has exhibited renewed bullish strength with the microflows and macrostructure alienated.
Yield Curve: Outlook For Growth, Inflation & Policies
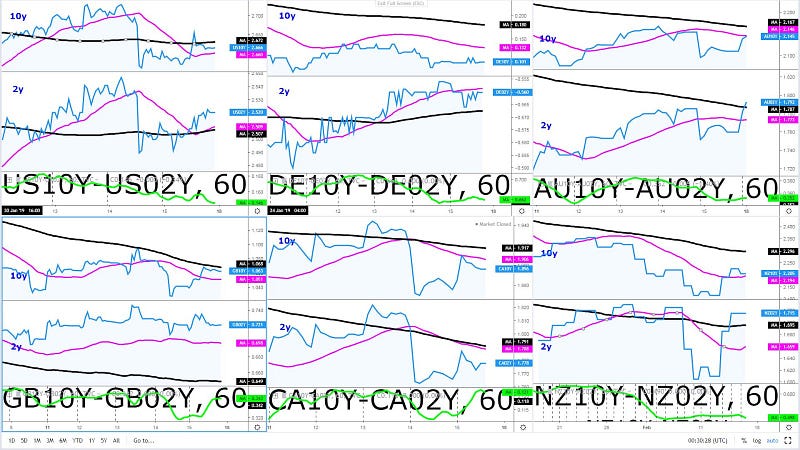
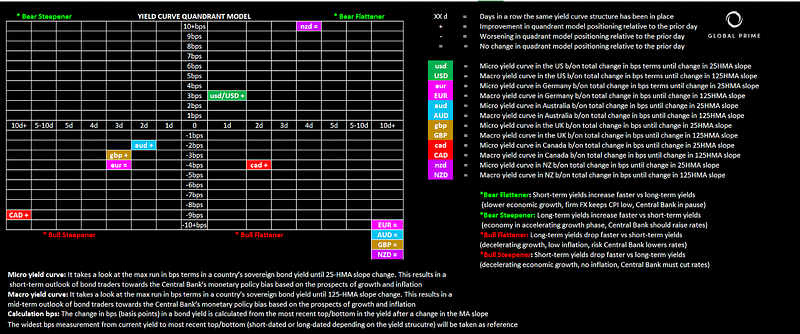
Out of the G6 countries monitored, the US is the best positioned fundamentally speaking. The US bond market is beginning to display signs of a potential recovery in growth and inflation, although by taking a closer examination to the chart, it should be taken with a huge bucket of salt as the major supply imbalance on Feb 14th still casts a major shadow. In terms of microflows, the major outperformer in the last week has clearly been New Zealand following the less dovish than expected outcome by the RBNZ, with the market adjusting its aggressive rate cut pricing. Even if other countries such as Canada, Australia or the UK have also experienced a tick up in long-dated yields, even if the microflows are not yet meeting the requirements, determined by the slope of the 25-HMA, to move away from bull steepening/flattening dynamics. When it comes to the more macro picture (5-day basis), using the 125-HMA (5-DMA) slope as a reference, despite the marginal recovery in yields, we are still far from the market shifting its views on the outlook for growth and inflation. We can interpret the short-term recovery in microflows as a function of the ‘risk on’ profile in the markets, which removes funding pressure on sovereign countries as investors seek out riskier bets than bonds, hence higher bond yields to stimulate investment in fixed income. However, once we step out a tiny bit to a 5-day outlook based on the 125-HMA slope, the reality has not changed and the concerns for a global growth slowdown remains the overarching view being expressed.
Intermarket Flows & Technical Analysis
EUR/USD: Stubborn Buying Off 1.1250, Break Of 1.13 Allows 1.1335–50
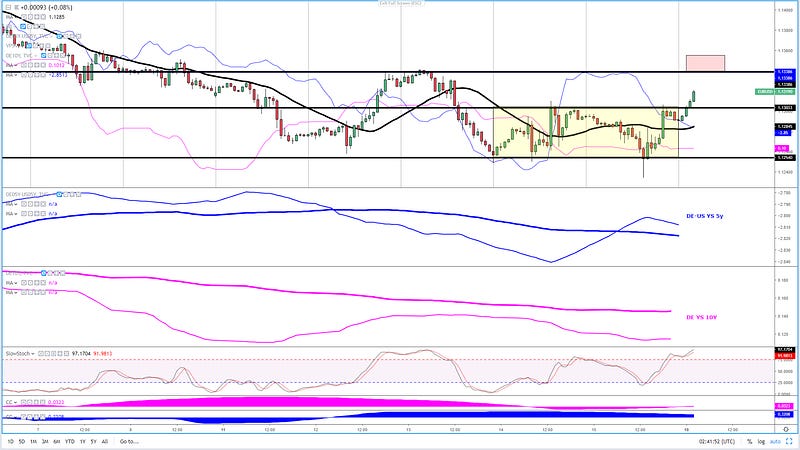
Technically, the market has clearly found stubborn buyers sub 1.1250, with the last 4 different time intervals to break below failing to find any acceptance. What was initially a compressed 1.1250–1.13 range (yellow box) is now expanding into a potentially wider 1.1250–1.1350 range, If the Euro prints gains above 1.13 and can consolidate above, that will be the very first time in February that the pair is finally showing signs of a bullish structure of higher highs in the hourly in February. However, to gain a further conviction on the technical outlook, the swing high of 1.1350 should be re-taken or else we run the risk of simply expanding the range into a 1c wide as mentioned.
From an intermarket flows (IMF) perspective, I will reiterate that trading the pair has been an extremely difficult exercise to pinpoint any external correlated asset acting as the driver. My hypothesis had been that the slower economic growth in the EZ was the main narrative the market latched on to drive the pair lower, that’s why as reference the German 10y acted as a fairly accurate leading indicator to gauge future market direction.
According to the 5-day correlation coefficient, the market appears to be clinging back to the old German-US yield spread as the #1 gauge for flows. If that’s the case, while evidence of bullish technical cracks in the DE-US YS 5y is evident, by the close of business in NY there is not yet a case to be made for a much higher exchange rate judging by both the microflows and the macrostructure (25 & 125-HMA respectively). Amid this backdrop, as long as the microflows in the yield spread stay predominantly down, I’d argue that any test of 1.1350 is still seen as a selling opportunity.
GBP/USD: Buy/Sell On Daily Range Expansion Has Logic
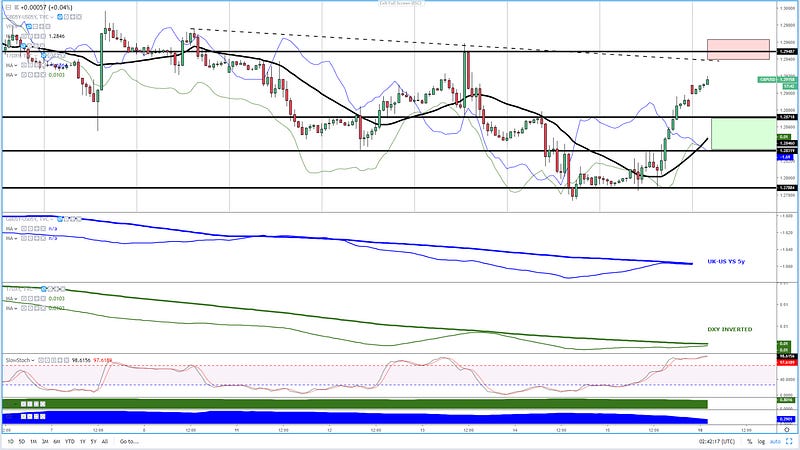
At the most granular level, the pair is starting to show clear signs of life after price broke above an intraday swing high at 1.2870–75. However, with the 3rd test of a descending trendline coming overhead at 1.2935–40 ahead of a horizontal resistance at 1.2950, the room for further appreciation appears to be rather limited. What’s more, the stochRSI is starting to reach overbought conditions, suggesting that a potential pullback intraday is likely to ease the overstretched conditions.
From an intermarket flows (IMF) perspective, we can clearly see via the 5-day correlation coefficient how the UK-US yield spread and the DXY inverted have acted as a formidable proxy to gauge the next market directions. Under such prognosis, we can notice that based on micro IMF, we are still in a buy-side mode based on the DXY with more of indecision according to the yield spread as the microflows based on the 25-HMA have turned flat. If a retest of the green box is accompanied by a sync upward slope in the DXY + UK-US YS, that may be a solid buy-side opportunity, which would be in line with the upward slope in the 25-HMA based on the most important factor, the price. From a macro view, with the 125-HMA (5-DMA) slope in sync bearish mode, a test of 1.2935–50 liquidity area represent a sell-side opportunity on such a macro backdrop, with the only nuance that may represent an impending risk being sync micro bullish flows in DXY/UK-US YS as the level is tested.
USD/JPY: Current Risk Profile Keeps Pair In Whipsaw State
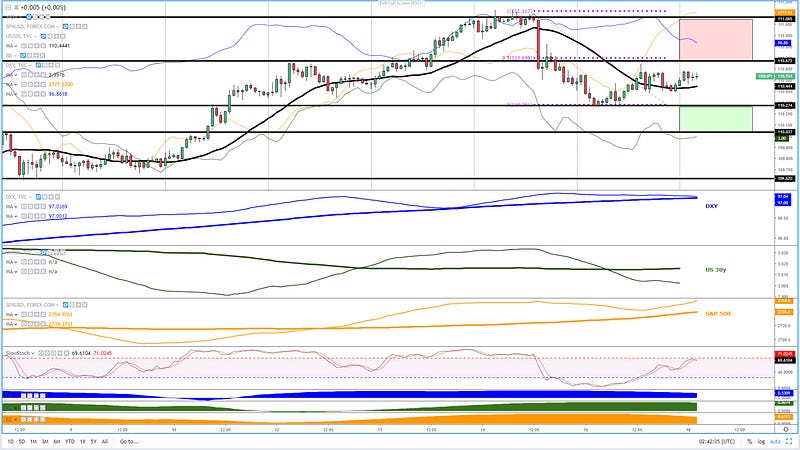
Even as sellers made progress by taking the exchange rate significantly away from its trend high, the rampant state of affairs in the US equity market is undoubtedly creating an excess of JPY supply in the market, which is resulting on the downside being well capped despite broad-based USD weakness from a microflows standpoint. It would have been a much uglier picture amid falling US30Y and DXY in the last 2 days if US equities had shown some fragility. The microflows state is characterized by USD weakness within a risk appetite context, which tends to results in fairly range bound conditions. If we take as reference the slope of the DXY & US30Y by the NY close, and in light of the absence of significant upside momentum despite the soaring state of the S&P 500, it makes me think that as long as the slope of the DXY/US 30Y 25-HMA (microflows) keep pointing lower, the red area should serve as a wide yet fairly good indicative area to look for sell-side opportunities. Similarly, if analogous conditions extend as the pair tests 110.25–30, be alerted for buy-side campaigns to be initiated. This latter scenario is further anchored by the notion that the macrostructure in intermarket flows (IMFs) continues to be supportive of buying the dips at discounted prices if price agrees.
AUD/USD: Buy On Weakness An Interesting Proposition
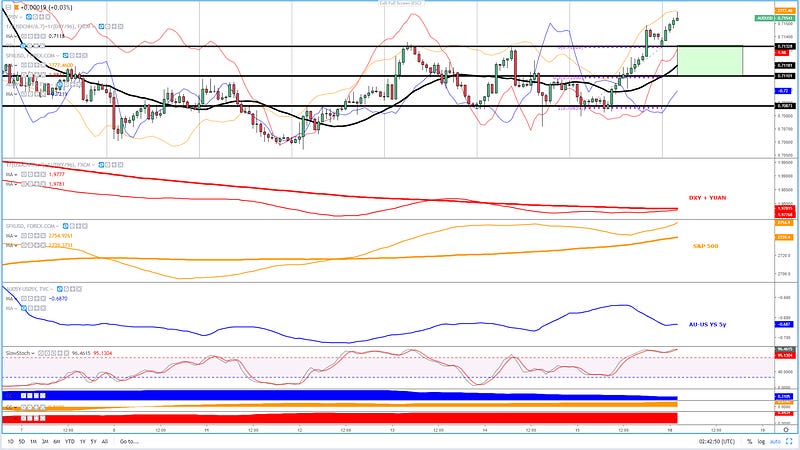
What one should notice in the Aussie market, as the 5-day correlation coefficient shows, is that it’s all about the direction of the Yuan + DXY to gauge the next bias. The S&P 500 is taking up the slack and playing a greater role in line with historical standards, while the yield spread correlation between the Australian and the US economy is now having a lesser impact.
As technicals and intermarket flows stand, this is the clearest market to get a signal from. When analyzing the DXY+Yuan as one driver alongside the S&P 500 as the #1 proxy for risk amid a risk profile environment dominated by stocks vs bond yields, here we can see that both the micro and macro slopes have turned upwards, which adds credence to the breakout of 0.7130 resistance. The improved technical outlook allows for the run-up to extend towards 0.7195–0.72 resistance. There are two downsides to the near term outlook though. Firstly, the price has clearly entered overbought conditions according to the slow stoch. Secondly, the Aus-US yield spread cannot be stripped out as it has played a leading role as of late. If the narrative were to shift back to the yield spread via an increasingly tighter correlation (currently at 0.3), the case for lower levels strengthens. The green box drawn should be a sensible area to engage in buy-side action should IMFs still agree.
USD/CAD: No Reason Not To Be A Seller At Discounted Prices
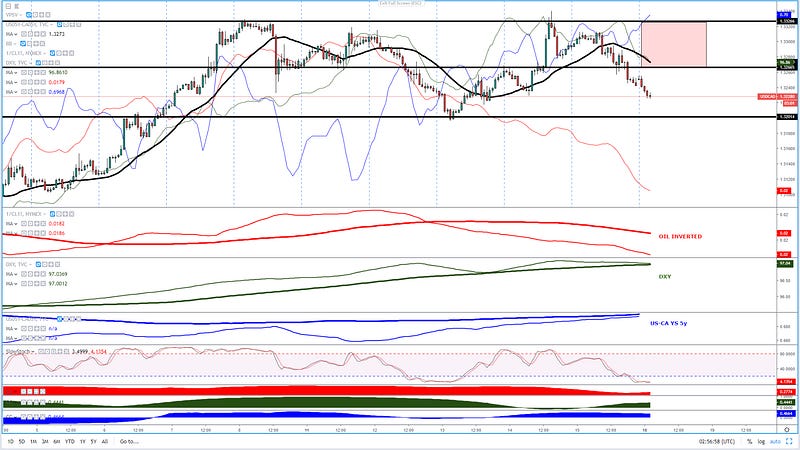
Until proven wrong, it appears as though this is a market currently dominated by a broad 1.32–1.3330 technical range, with the present flows aggressively selling the spot. The present dominance of CAD buy-side flows in the pair comes as a result of the bullish breakout in Oil coupled with an environment of USD weakness across the board. That’s the perfect bullish storm for the pair, one that in the majority of cases, as it’s the case at the moment, will shrug off any US-CA yield spread advantage.
Using as reference the micro slopes in the 25-HMA to gauge the short-term intermarket flows, this is a market that looks like is destined to reach its next target at 1.32. As long as the microflows remain in favor of Oil (inverted) and the DXY moving in the same downward direction, selling on rallies is the way to go. Be aware, the market is currently quite oversold, so where the red box has been dawn would be the ideal area where the sell-side campaign may be initiated with the best risk-reward prospects. Remember, this scenario assumes that current intermarket flows will remain favorable.
Important Footnotes
- Risk model: The fact that financial markets have become so intertwined and dynamic makes it essential to stay constantly in tune with market conditions and adapt to new environments. This prop model will assist you to gauge the context that you are trading so that you can significantly reduce the downside risks. To understand the principles applied in the assessment of this model, refer to the tutorial How to Unpack Risk Sentiment Profiles
- Cycles: Markets evolve in cycles followed by a period of distribution and/or accumulation. The weekly cycles are highlighted in red, blue refers to the daily, while the black lines represent the hourly cycles. To understand the principles applied in the assessment of cycles, refer to the tutorial How To Read Market Structures In Forex
- POC: It refers to the point of control. It represents the areas of most interest by trading volume and should act as walls of bids/offers that may result in price reversals. The volume profile analysis tracks trading activity over a specified time period at specified price levels. The study reveals the constant evolution of the market auction process. If you wish to find out more about the importance of the POC, refer to the tutorial How to Read Volume Profile Structures
- Tick Volume: Price updates activity provides great insights into the actual buy or sell-side commitment to be engaged into a specific directional movement. Studies validate that price updates (tick volume) are highly correlated to actual traded volume, with the correlation being very high, when looking at hourly data. If you wish to find out more about the importance tick volume, refer to the tutorial on Why Is Tick Volume Important To Monitor?
- Horizontal Support/Resistance: Unlike levels of dynamic support or resistance or more subjective measurements such as fibonacci retracements, pivot points, trendlines, or other forms of reactive areas, the horizontal lines of support and resistance are universal concepts used by the majority of market participants. It, therefore, makes the areas the most widely followed and relevant to monitor. The Ultimate Guide To Identify Areas Of High Interest In Any Market
- Trendlines: Besides the horizontal lines, trendlines are helpful as a visual representation of the trend. The trendlines are drawn respecting a series of rules that determine the validation of a new cycle being created. Therefore, these trendline drawn in the chart hinge to a certain interpretation of market structures.
- Correlations: Each forex pair has a series of highly correlated assets to assess valuations. This type of study is called inter-market analysis and it involves scoping out anomalies in the ever-evolving global interconnectivity between equities, bonds, currencies, and commodities. If you would like to understand more about this concept, refer to the tutorial How Divergence In Correlated Assets Can Help You Add An Edge.
- Fundamentals: It’s important to highlight that the daily market outlook provided in this report is subject to the impact of the fundamental news. Any unexpected news may cause the price to behave erratically in the short term.
- Projection Targets: The usefulness of the 100% projection resides in the symmetry and harmonic relationships of market cycles. By drawing a 100% projection, you can anticipate the area in the chart where some type of pause and potential reversals in price is likely to occur, due to 1. The side in control of the cycle takes profits 2. Counter-trend positions are added by contrarian players 3. These are price points where limit orders are set by market-makers. You can find out more by reading the tutorial on The Magical 100% Fibonacci Projection
The Daily Edge is authored by Ivan Delgado, Head of Market Research at Global Prime. The purpose of this content is to provide an assessment of the market conditions. The report takes an in-depth ...
more

