
US Dollar Softens At Resistance As Dow, S&P Attempt To Stabilize
US DOLLAR PULLS BACK FROM KEY RESISTANCE AT OCTOBER HIGHS
The US Dollar is pulling back from a key resistance level this morning after what’s become a really strong week. It didn’t start out that way, however, as Tuesday brought upon a test through support at 95.00 that was followed by a very visible showing from bulls that’s only now started to calm. The resistance level that’s helping to cap the morning’s highs was looked at in yesterday’s webinar, and this comes in at 96.04, which is the 50% marker of the 2017-2018 bearish move in DXY. This is also the same price that’s helped to hold resistance in the US Dollar for the past three weeks, as can be seen from the weekly chart below:
US DOLLAR WEEKLY PRICE CHART
(Click on image to enlarge)
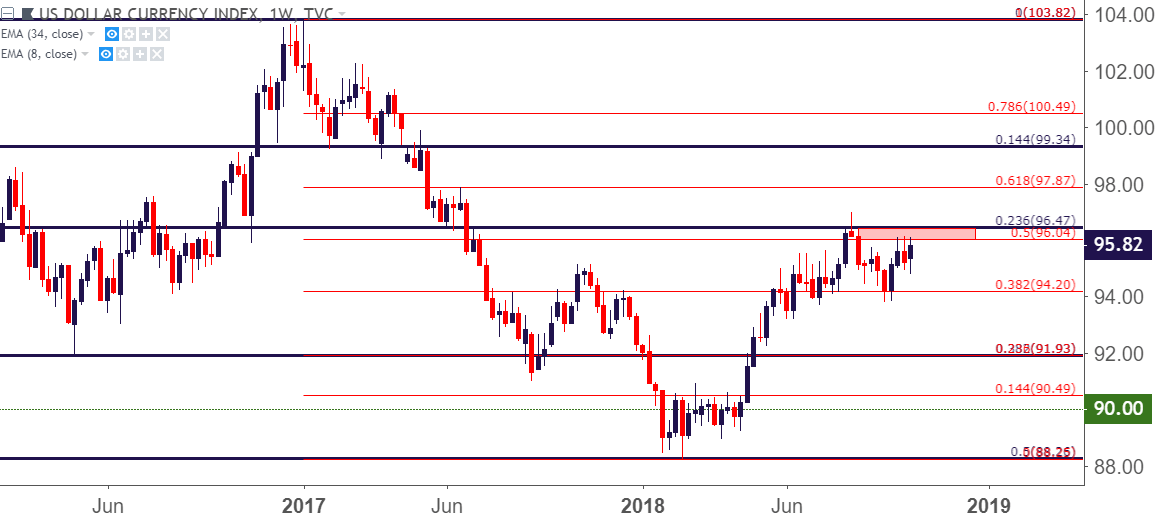
Chart prepared by James Stanley
The big question around the Dollar for next week is whether the currency can finally pose a lasting push through this resistance. There was a similar such instance in August, and this is when the Dollar was pushing higher on the back of risk aversion themes as worries were growing around European banks’ exposure to Turkey. But, as markets stepped back from the ledge, so did the US Dollar, and prices fell for much of the remainder of Q3.
But, given the increased focus around the European Commission and the Italian budget, the potential for greater risk aversion is there, and that could compel another topside push through resistance.
Next week’s economic calendar brings an item of interest in that regards, as the Thursday ECB meeting is the high point, and this is when markets will get to hear from ECB President Mr. Mario Draghi on a number of issues. This, of course, is on top of the unpredictable headline-driven volatility that will likely continue to emanate out of Brussels and Rome. Also of interest is a Wednesday rate decision at the Bank of Canada with a strong expectation for a 25 basis point rate hike.
DAILYFX ECONOMIC CALENDAR: HIGH-IMPACT EVENTS FOR THE WEEK OF OCTOBER 22ND, 2018
(Click on image to enlarge)
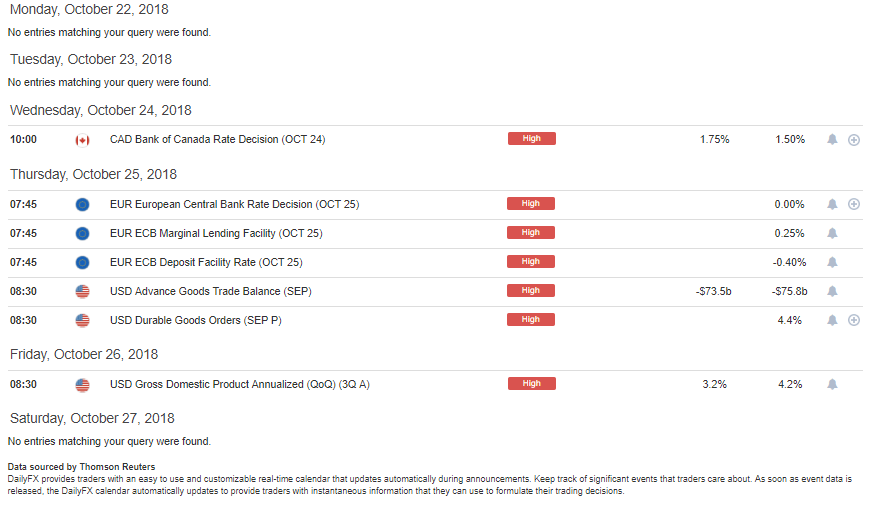
Chart prepared by James Stanley
US DOLLAR RANGING SO FAR IN Q4
Three weeks into Q4 and the net of price action in the US Dollar has been a range. After opening the quarter near the 95.00 level, with a quick support check as Q3 came to a close and again after Q4 opened, DXY pushed up to the 96.04 level and failed to push through on two separate occasions. Then after another revisit to 95.00, punctuated by the Tuesday test-below, buyers have come back to prod prices right back up to resistance at 96.04.
US DOLLAR TWO-HOUR PRICE CHART: Q4 RANGE RESISTANCE RE-TEST
(Click on image to enlarge)
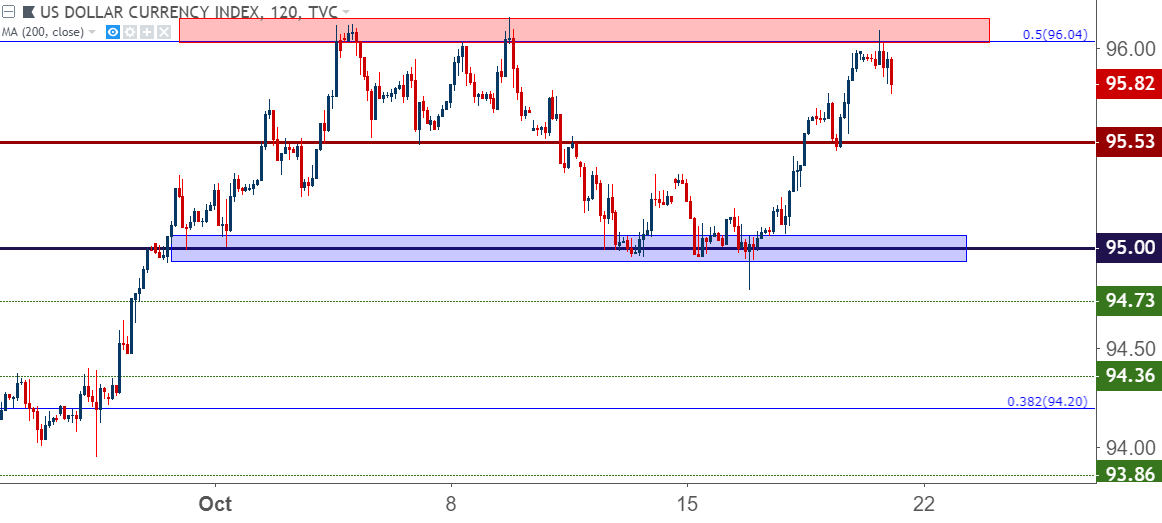
Chart prepared by James Stanley
EUR/USD DIGS INTO SUPPORT AS SELLERS SLOW DOWN
This was a key point in yesterday’s webinar, but EUR/USD is testing what’s become a stubborn area of support. The price of 1.1448 is the 50% marker of the 2017-2018 bullish move in the pair, and this price helped to hold the lows after a test earlier in the month. This can be a tough area for fresh shorts to trigger outside of any new bearish drivers in the pair, and markets will likely need another gust of risk aversion if this support is to be taken-out ahead of this week’s close.
EUR/USD FOUR-HOUR PRICE CHART
(Click on image to enlarge)
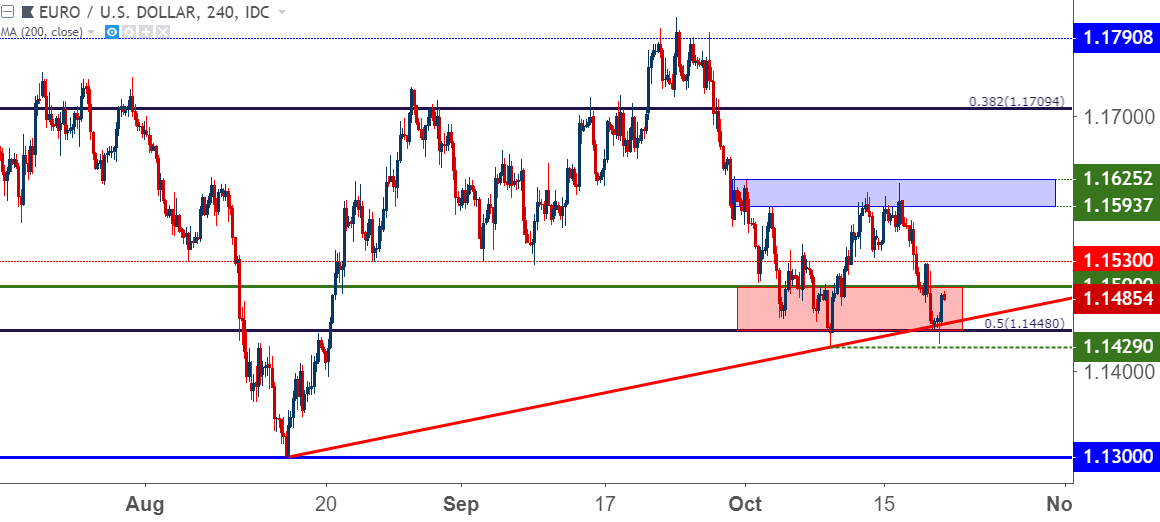
Chart prepared by James Stanley
US EQUITIES CONTINUE TO TRY TO RE-GAIN FOOTING
Yesterday brought another gust of risk aversion to US stocks. But sellers didn’t quite pack the same punch that they did last week when equities rushed down to fresh near-term lows. Yesterday’s hit stopped short of a re-test of those levels from last week, and so far for this week price action has produced a spinning top on the weekly time frame.
DOW JONES WEEKLY PRICE CHART
(Click on image to enlarge)
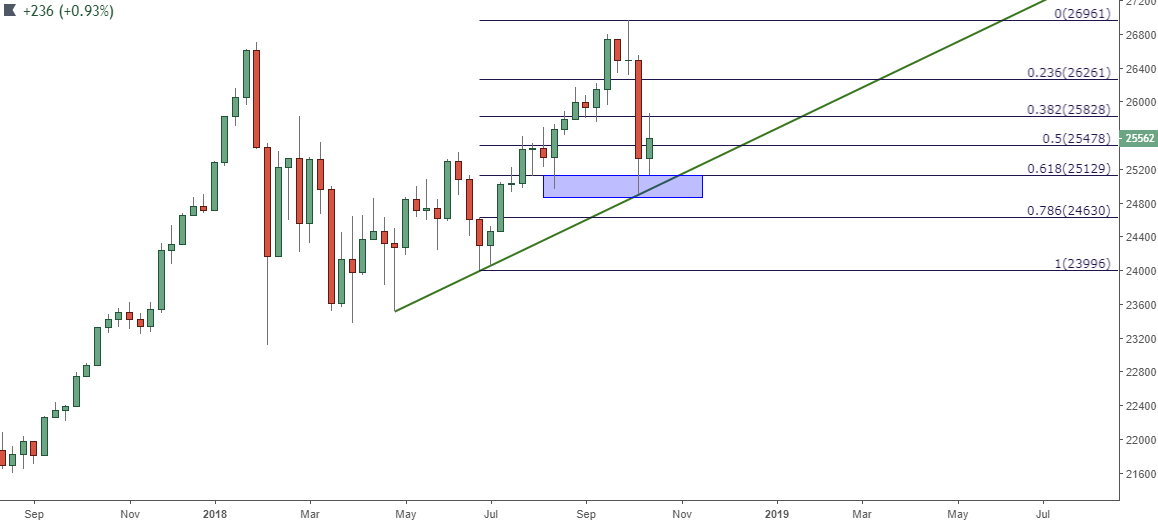
Chart prepared by James Stanley
On a shorter-term basis, that potential for a return of bullish price action remains, and a down-side break through a confluent area of support could usher in bigger-picture bearish themes. So, at the very least, this offers an area for stop placement in which the trader can bail out of the position as signs of turbulence show.
DOW JONES DAILY PRICE CHART
(Click on image to enlarge)
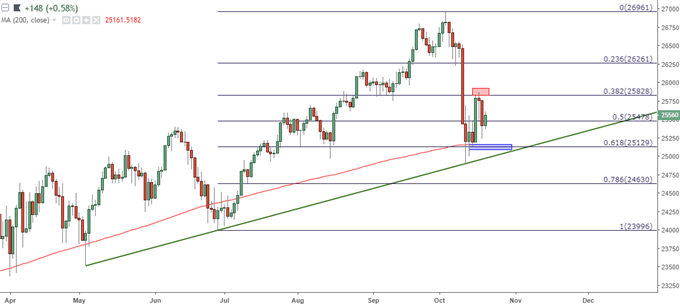
Chart prepared by James Stanley
S&P CAUTERIZES SUPPORT AT 78.6% RETRACEMENT OF Q3 BULLISH MOVE
The S&P 500 is putting in a similar effort of stabilization this week, with Wednesday resistance posting at the 50% marker of the Q3 bullish move after a build of support had come-in off of the 78.6% Fibonacci retracement. A top-side break back-above the 50% marker, or this week’s high re-opens the door to bullish continuation strategies on the index; but given the pace of the pullback compared to the Dow Jones above, traders would likely want to focus bullish equity strategies in the Dow given that last week’s pullback was a bit more shallow and the basis for support appears to offer more optimal construction.
SPX500 DAILY PRICE CHART
(Click on image to enlarge)
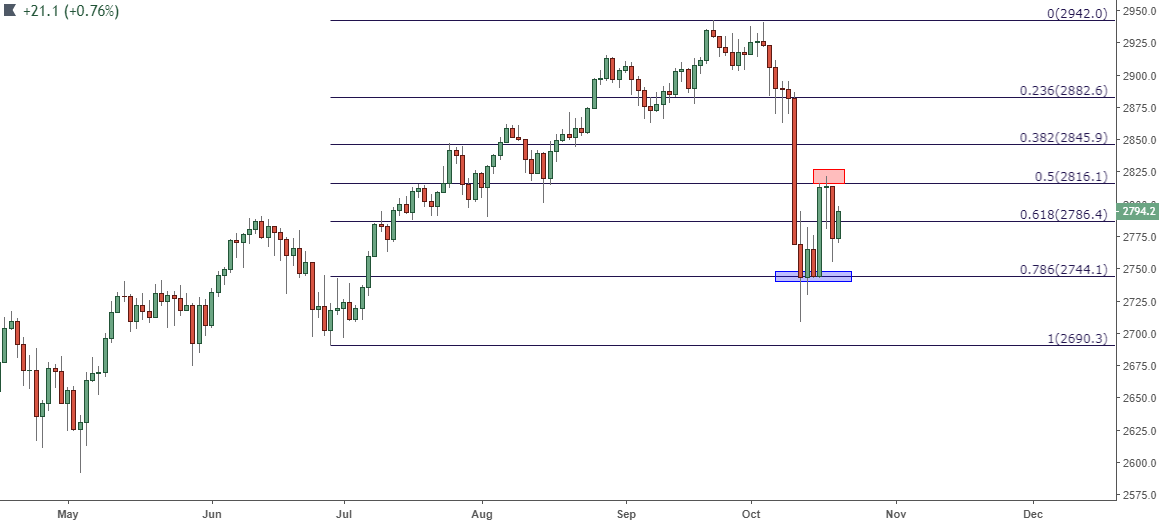
Chart prepared by James Stanley
Disclosure: Do you want to see how retail traders are currently trading the US Dollar? Check out our IG Client Sentiment ...
more

