
US Dollar Price Volatility Report: Dovish Fed Bets Firm, Liquidity Up
US Dollar price action is currently gravitating slightly above confluent support provided by the DXY Index’s 50-week simple moving average as well as the 23.6% Fibonacci retracement level of its trading range since the greenback’s February 2018 swing low. Yet, aggressive selling across major USD currency pairs over the last several days pushed the US Dollar Index below rising trendline support that connects the series of higher lows recorded early last year to the higher swing low printed this past June, which also appears to form a rising wedge chart pattern.
US DOLLAR INDEX PRICE CHART: WEEKLY TIME FRAME (OCTOBER 02, 2017 TO OCTOBER 21, 2019)
(Click on image to enlarge)
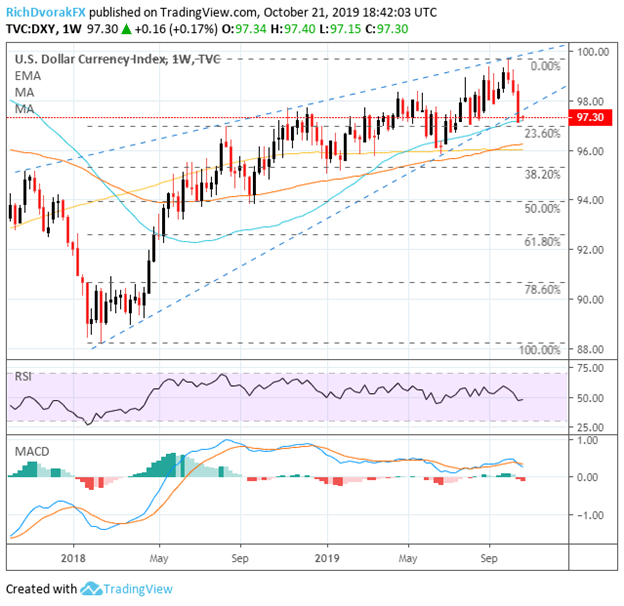
Chart created by @RichDvorakFX with TradingView
That said, if the 50-week SMA fails to keep the US Dollar afloat, the DXY Index has potential to sink even lower toward the 96.00 handle and approach confluent support near its 100-week exponential moving average and 200-week SMA. Moreover, the RSI remains below 50 and the magnitude of bearish divergence has gained pace as indicated by the MACD amid lingering USD weakness.
FED INTEREST RATE CUT PROBABILITIES (OCTOBER 2019)
(Click on image to enlarge)
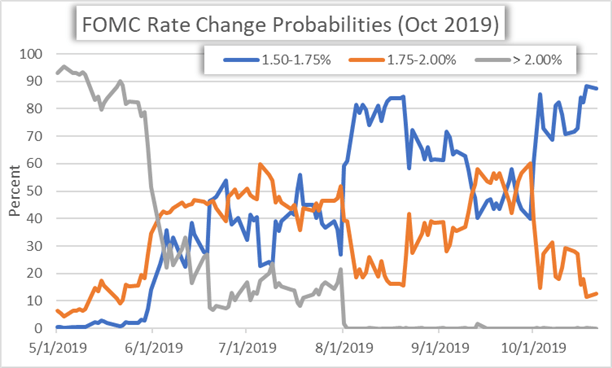
The Federal Reserve (Fed) is officially in its blackout period where FOMC officials are restricted from commenting on monetary policy and the economy in the runup to an upcoming interest rate decision. The Fed is expected to meet at the end of the month following back-to-back interest rate cuts at the July and September Fed meetings.
According to overnight swaps, traders are currently pricing in an 87.3% probability that the FOMC cuts rates for a third consecutive meeting, which would lower the Federal funds rate (FFR) to a target range of 1.50-1.75%. This is up considerably from the 60.5% probability priced in earlier this month – even despite positive fundamental developments like the supposed ‘phase 1 US-China trade agreement.’
FEDERAL RESERVE BALANCE SHEET EXPANSION CONTINUES AS FOMC INJECTS LIQUIDITY
(Click on image to enlarge)
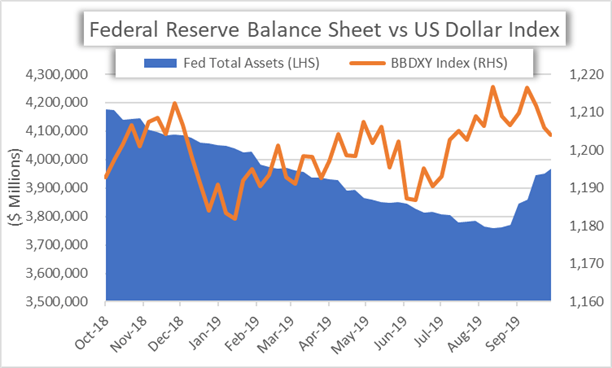
One potential explanation for weaker US Dollar exchange rates could be due to the Federal Reserve’s balance sheet expansion over the last few weeks as the central bank aims to calm recent repo market madness. Though Fed Chair Powell explicitly told markets that organic balance sheet growth in pursuit of determining an appropriate level of bank reserves is “not to be confused with quantitative easing (QE),” the action nevertheless boosts US Dollar liquidity. In turn, following the basic economic principles of supply and demand, a greater supply of US Dollars in circulation as a result of FOMC operations could be expected to result in lower prices (holding demand constant).
US DOLLAR IMPLIED VOLATILITY & TRADING RANGES (1-WEEK)
(Click on image to enlarge)
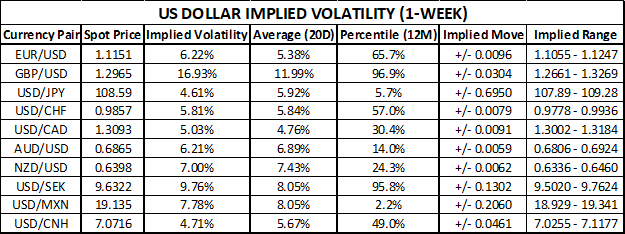
I pointed out in this daily US Dollar Price Volatility Report publication this past Friday that forex traders will likely look to fundamental forces such as the release of US Durable Goods data, Brexit latest, an ECB rate decision and looming trade war headlines throughout the week for clues on where USD price action might head next. Scheduled event risk for Tuesday’s trading session is a bit light according to the Forex Economic Calendar, though that is not to say markets will lack catalysts for volatility.
In fact, the ECB will publish its bank lending survey, the UK will release public sector net borrowing data while British MPs are expected to vote on PM Boris Johnson’s Brexit bill, and Canadian retail sales, as well as US, existing home sales figures are expected to cross the wires. As such, EUR/USD, GBP/USD, USD/CAD and USD/JPY take the spotlight.
US DOLLAR RISK REVERSALS (1-WEEK)
(Click on image to enlarge)
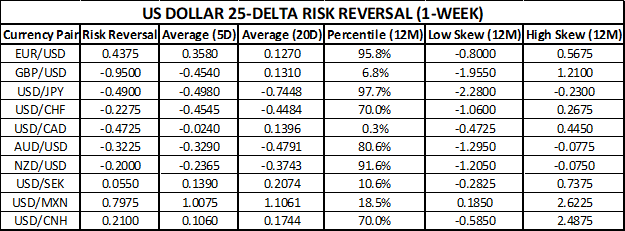
A risk reversal reading above zero indicates that the demand for call option volatility (upside protection) exceeds that of put option volatility (downside protection). For additional insight on market positioning and bullish or bearish biases, traders can turn to the IG Client Sentiment data, which is updated in real-time and covers several currency pairs, commodities, and equity indices.


