
US Dollar Price Forecast: Can USD Bulls Really Take Control?
So we’re not even two weeks into the New Year but given the pace of the US Dollar sell-off last year, it's still at least somewhat notable that the currency has been able to continue gaining over the past week. This doesn’t necessarily eliminate the down-trend that’s been in force since March of last year when the pandemic had started to get priced into markets, but it does highlight the potential for a continued short-squeeze scenario in the US Dollar as we get deeper into 2021 trade.
As looked at in the webinar last week, the backdrop was seemingly open for a pullback in the bearish trend. This was supported by a couple of different drives: A) the build of a falling wedge formation, which will often be approached with the aim of bullish reversals, and B) an extended case of RSI divergence on a number of charts.
As I also shared in that webinar last week, I’m still bearish on the US Dollar, and that’s reflected in the Q1 technical forecast for USD. The complication to bearish strategies at the moment is just how oversold the currency was coming into the New Year, combined with those bullish indications as noted above. So far in 2021, that’s amounted to a bullish outlay with a pullback in the bearish trend. But, this may not last for long depending on how the rest of this week goes…
The next few days bring some highly important data into the equation, and that’s Wednesday’s US inflation data ahead of Friday’s Retail Sales data. Both are high-impact prints and each can serve to extend or reverse trends in the USD.
DAILYFX ECONOMIC CALENDAR: HIGH-IMPACT US ITEMS REMAINING FOR THIS WEEK
(Click on image to enlarge)
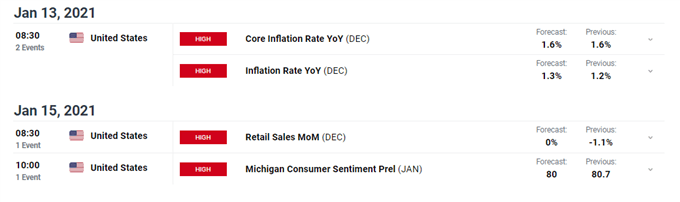
Source: DailyFX Economic Calendar, High-Impact US items
On a short-term basis, the US Dollar may have motive for pushing-lower today. This week saw DXY gap-higher at the open to continue trading higher. At this point, some unfilled gap remains on the chart, and this is down towards the psychological 90.00 level on DXY. So far this week, a short-term symmetrical wedge formation has built, with support holding above that unfilled gap.
US DOLLAR TWO-HOUR PRICE CHART
(Click on image to enlarge)
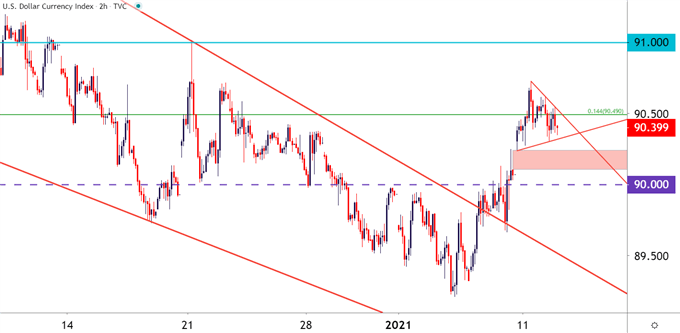
Chart prepared by James Stanley; USD, DXY on Tradingview
Taking a step back on the chart and we’re basically seeing a hold of resistance around the 90.49 level, which was looked at as potential resistance in last week’s webinar. This is the 14.4% Fibonacci retracement of the 2017-2018 major move in the currency, and this price came into play as support in early-December before succumbing to selling pressure in the middle of last month.
A bit higher on the chart is another area of potential resistance around the 91.00 handle, as this helped to set the swing-high on DXY in the second half of December; and above that is a big zone of possible resistance around 92.00. There are two different Fibonacci retracement levels in close proximity and if USD bulls can continue to push, the area around 92.00 could become very interesting for short-side swing scenarios.
US DOLLAR EIGHT-HOUR PRICE CHART
(Click on image to enlarge)
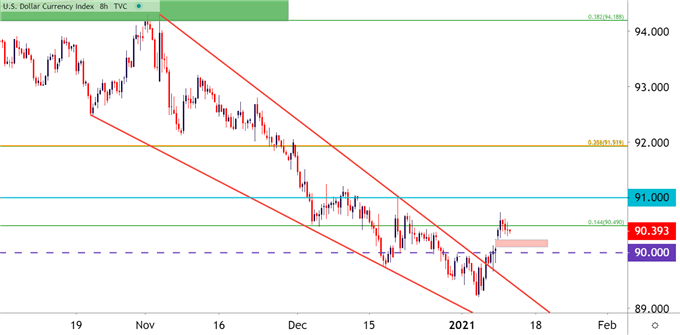
Chart prepared by James Stanley; USD, DXY on Tradingview
Disclosure: See the full disclosure for DailyFX here.


