
US Dollar Index Stays Under Pressure Around 90.00
The US Dollar Index (DXY), which tracks the greenback vs. a bundle of its main competitors, comes under extra selling pressure on Friday, although it manages well to keep business above the 90.00 level for the time being.

Image Source: Pixabay
US Dollar Index looks to yields, data
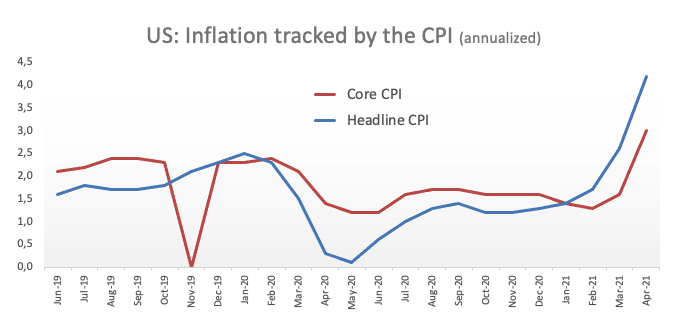
The index sheds ground for the second session in a row following declining US yields and leaving behind the release of US inflation figures for the month of May.
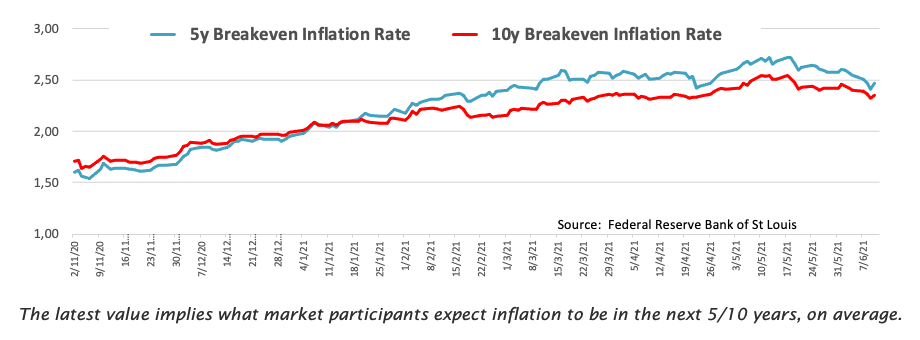
Indeed, yields of the key US 10-year reference dropped to levels last seen in early March around 1.43% in spite of higher-than-expected inflation figures during last month, as investors appear more convinced that the Fed would stick to its mega-accommodative stance for the foreseeable future.
(Click on image to enlarge)
In the US data space, the advanced Consumer Sentiment for the month of June will be the sole release later in the NA session.
What to look for around USD
The index so far survives above the 90.00 neighbourhood, which has emerged as a tough barrier for dollar bears. Higher inflation figures in May failed to ignite a serious bullish attempt in the buck while they also forced yields to recede to multi-month lows well below 1.50%. The outlook for the currency still remains on the negative side and this view is supported by the perseverant mega-dovish stance from the Federal Reserve (until “substantial further progress” in inflation and employment is made) in place for the time being and rising optimism on a strong global economic recovery, which is seen underpinning the risk complex.
Key events in the US this week: Flash June Consumer Sentiment.
Eminent issues on the back boiler: Biden’s plans to support infrastructure and families, worth nearly $6 trillion. US-China trade conflict under the Biden’s administration. Tapering speculation vs. economic recovery. US real interest rates vs. Europe. Could US fiscal stimulus lead to overheating?
US Dollar Index relevant levels
Now, the index is losing 0.01% at 90.03 and faces the next support at 89.53 (monthly low May 25) followed by 89.20 (2021 low Jan.6) and then 88.94 (monthly low March 2018). On the other hand, a breakout of 90.62 (weekly high Jun.4) would open the door to 90.90 (weekly high May 13) and finally 91.04 (100-day SMA).
Disclosure: Information on this article contains forward-looking statements that involve risks and uncertainties. Markets and instruments profiled on this page are for informational purposes ...
more

