
US Dollar Goes Haywire On Fed-Speak Mis-Fire: Now What?
The latter portion of yesterday’s US session was interesting. In a speech from the NY Fed President, John Williams said the bank should ‘act quickly.’ And with global markets focusing-in on the Fed for the FOMC rate decision in two weeks, that comment was inferred to mean that the bank is currently looking to get very dovish very quickly in the effort of addressing the current growth slowdown. This off-hand comment punched the US Dollar lower and Gold prices caught a firm bid to drive up to fresh six-year-highs. The intra-day losses that had shown in US equity bourses were quickly erased ahead of the close as it appeared as if the world’s largest Central Bank was ready to start a new trend of softening that could be here for a little while; running in stark contrast to the one rate cut that the bank had forecast at their June rate decision.
In rates markets, there was a near-immediate pricing-in of 50 basis points of softening at the July rate decision. Ahead of that comment, odds were showing at around 38%. Shortly after this made its way through markets, those odds jumped up to 63.5%, as discussed by our own Rich Dvorak.
Later in the evening, however, the NY Fed came out with a correction. The bank said that the comment from Mr. Williams was in reference to longer-term economic research and that he didn’t necessarily mean to remark on near-term dynamics. And just as quickly as the US Dollar had dropped previously, strength showed back up and many of the above-mentioned themes pulled back.
On the below hourly chart of the S&P 500, the bounce coming in off of those comments from John Williams is very clear, as it erased the entirety of the early-day losses in the index with resistance coming-in off of the 14.4% Fibonacci retracement of the recent bullish move.
S&P 500 HOURLY PRICE CHART
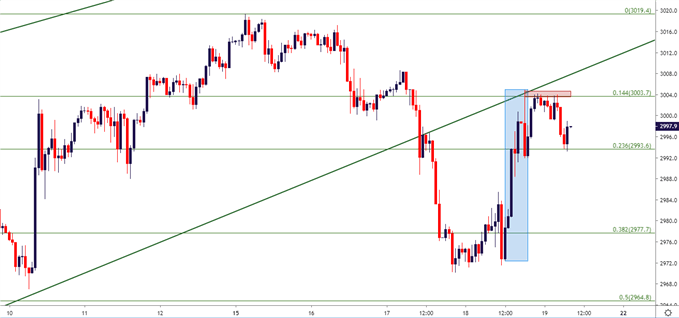
Chart prepared by James Stanley
Taking a step back on the S&P to the four-hour chart, and there could be scope for sell-off, particularly given the fact that the bullish driver that catapulted this thing higher yesterday has been walked-back. And speaking to the prospect of a 50 basis point cut in two weeks, this morning brought comments from one of the more bearish FOMC members of James Bullard, where he didn’t seem to entertain the possibility at all.
So through the chaos of yesterday’s drive, we’re practically back to where we had started as there is no clear evidence that the Fed is looking at this oncoming rate cut as anything more than a one-off adjustment after ‘over-tightening’ last year.
From the four-hour chart of the S&P 500, resistance has shown around the under-side of a prior bullish trend-line, confluent with the 14.4% Fibonacci retracement of the recent bullish move.
S&P 500 FOUR-HOUR PRICE CHART
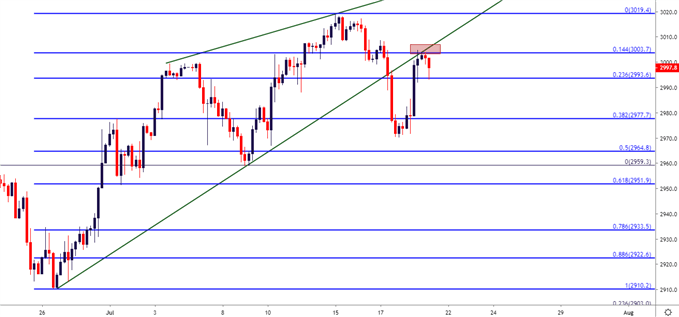
Chart prepared by James Stanley
US DOLLAR OUTLOOK UNCLEAR AS FOMC MOVES INTO BLACKOUT PERIOD
This Saturday marks the start of the Fed’s ‘blackout period,’ meaning that bank members are prohibited from media engagements in the effort of avoiding scenarios similar to what we’ve just seen. But this leaves market participants to their own devices as projections will likely continue to run wild as to what the Fed might actually do, and how they may do it.
In the US Dollar, the currency was on its back foot for most of yesterday after some dovish comments from Fed Vice Chair, Richard Clarida; but USD was absolutely slammed around these Williams remarks. Since the NY Fed has walked that back, however, a strong topside move has since developed, and it could be difficult to pick the proper direction here as there is now motive on either side of the scenario. This is the type of situation in which balancing risk around the US Dollar as part of the overall strategy could be a very attractive way of going about matters.
US DOLLAR DAILY PRICE CHART
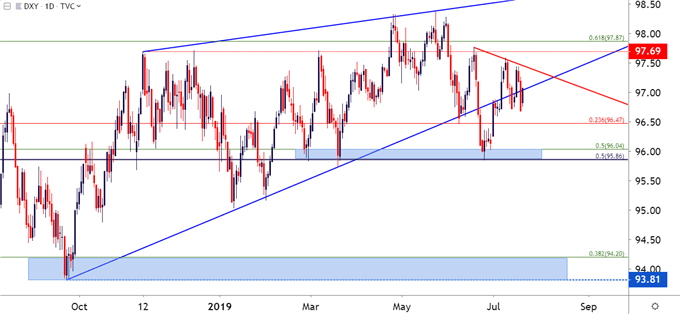
Chart prepared by James Stanley
WHAT COULD BE MORE CLEAR? GOLD…
In a market environment that hangs on the balance of what a few people might decide to do, there isn’t a lot that’s certain right now. Perhaps thickening the drama is that its not just about what they do, but how they do it. Will the Fed pitch this rate cut as a one-off? Or, will they highlight the potential for more softening down-the-road in the effort of re-spurring growth in the US economy? This can be a difficult case to make at the moment from the perspective of the bank’s dual mandate. Neither inflation nor employment are looking in dire need of support at the moment.
But there remains a fairly massive disconnect between market expectations and FOMC projections. Markets want to see three rate cuts by the end of this year. The Fed, at this point, has only talked about the possibility of one.
The one item that is clear is that rate hikes probably aren’t happening anytime soon around the FOMC; or any other major Central Banks for that matter. And this is the type of environment in which Gold gets very interesting, as witnessed over the past six weeks as the yellow metal has broken out to fresh six-year-highs.
At this stage, Gold prices have pulled back as those Williams comments were ‘re-clarified,’ but support is now showing at prior resistance. This prior resistance zone runs from 1421-1433, and hold here can keep the door open for bullish strategies. If USD-strength does continue to show ahead of the Fed, there’s scope for deeper support even-lower on the chart, as discussed earlier this week ahead of the breakout.
GOLD PRICE FOUR-HOUR CHART
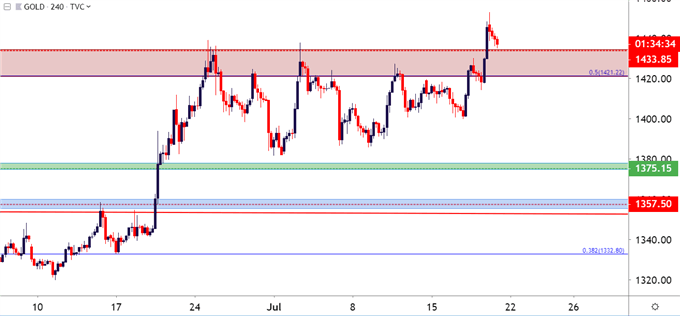
Chart prepared by James Stanley


