
US Dollar Forecast: DXY Index Hits Critical Resistance - Levels For USD/JPY
The US Dollar has been trading sideways for a few weeks, but there is growing evidence that traders are becoming less concerned about the Federal Reserve’s interest rate cut cycle. Capital shifting from bonds to stocks has reduced demand for safe haven assets, weighing down the US Dollar – even as Fed interest rate cut odds have dissipated in the week since the October Fed meeting.
US TREASURY YIELD CURVE PERKS UP
The US Treasury yield curve has been moving away from inversion territory for several weeks – in fact, throughout October, pre-dating the Fed meeting last week. Much of this was driven by the notion that the US-China trade war would be coming to an end, and as a result, global growth concerns would dissipate.
Falling rate cut odds have produced a relatively faster rise by long-end yields compared to short-end yields, a sign that market participants don’t believe that the US will fall into recession soon (and thus reducing the need for looser monetary conditions).
US TREASURY YIELD CURVE: 1-MONTH TO 30-YEARS (NOVEMBER 6, 2019) (CHART 1)
(Click on image to enlarge)
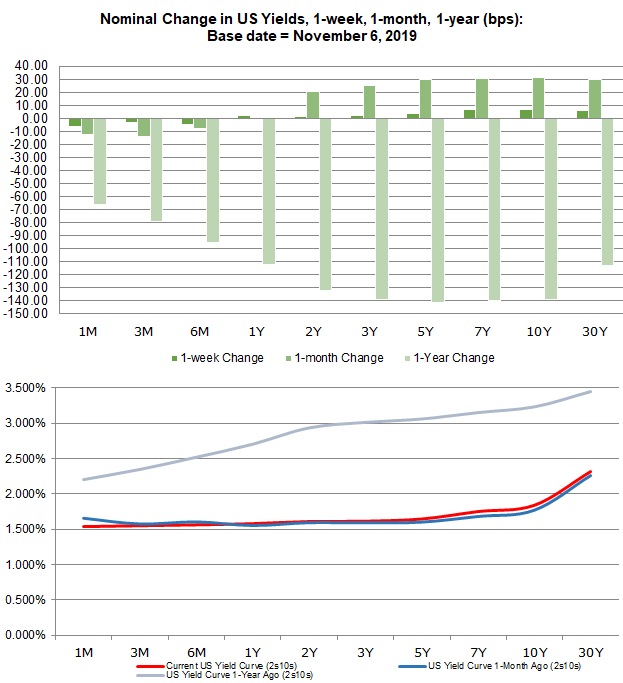
The bearish steepening of the US Treasury yield curve – short-end yields are rising slower than long-end yields – has proven to be a bellwether of improved sentiment among market participants. The steepening yield curve is typically a positive development for risk appetite. As the US Treasury yield curve steepened last month (the 3m10s spread moved from -11.4-bps to 18-bps in October), the DXY Index dropped by -2.8.
Fed Rate Cut Cycle Winding Down
According to Fed funds futures, there is a 12% chance of a 25-bps rate cut at the December Fed meeting (or an 88% chance of no change in interest rates). Low rate cut odds are not a surprise following Fed Chair Jerome Powell’s remarks at the October Fed meeting where he all but closed off the path to any further rate moves. As a result, there is no greater than a 48% chance of a rate move in either direction over the next six months.
FEDERAL RESERVE INTEREST RATE EXPECTATIONS (NOVEMBER 6, 2019) (TABLE 1)
(Click on image to enlarge)
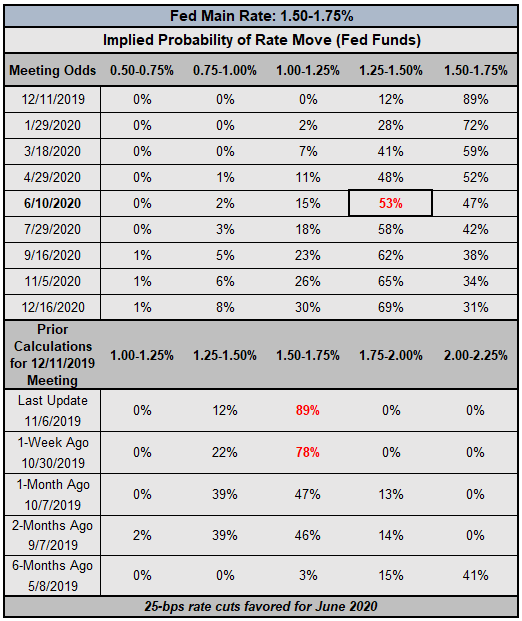
There has been a clear trajectory for a less dovish Fed in recent weeks: one month ago on October 7, there was a 39% chance of the main rate dropping to 1.25-1.50% at the December Fed meeting. At the end of last week, the next rate cut was priced-in for March 2020; now, markets are favoring June 2020.
EURODOLLAR CONTRACTS SEE DIMINISHED FED RATE CUT CYCLE
We can measure whether a rate cut is being priced-in using Eurodollar contracts by examining the difference in borrowing costs for commercial banks over a specific time horizon in the future. Eurodollar contracts continue to be closely aligned with Fed funds regarding the scope and scale of the Fed rate cut cycle.
The chart below showcases the difference in borrowing costs – the spreads – for the continuous front-month/January 20 (orange) and the continuous front-month/June 20 (blue), in order to gauge where interest rates are headed in the December 2019 Fed meeting and the June 2020 Fed meeting.
EURODOLLAR CONTRACT SPREADS – CONTINUOUS FRONT MONTH/JANUARY 20 (ORANGE), CONTINUOUS FRONT MONTH/JUNE 20 (BLUE) (MAY 2019 TO NOVEMBER 2019) (CHART 2)
(Click on image to enlarge)
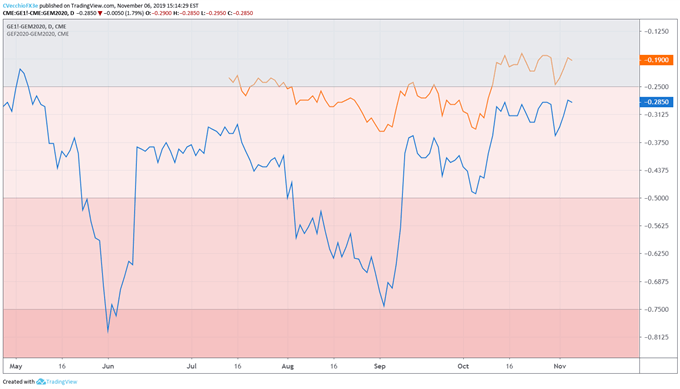
Based on the Eurodollar contract spreads, there is there is a 40% chance of a 25-bps rate cut by the end of the year –more aggressive than the Fed fund’s implied probability of 12%. Through June 2020, Eurodollar contracts are pricing in a 100% chance of one 25-bps rate cut and a 14% chance of two 25-bps cuts; on the other hand, Fed funds are pricing in a 53% chance of two 25-bps by that point in time. Historically, wide gaps in rate expectations between Eurodollars and Fed funds leads to volatility in USD-pairs.
DXY PRICE INDEX TECHNICAL ANALYSIS: DAILY CHART (NOVEMBER 2018 TO NOVEMBER 2019) (CHART 3)
(Click on image to enlarge)
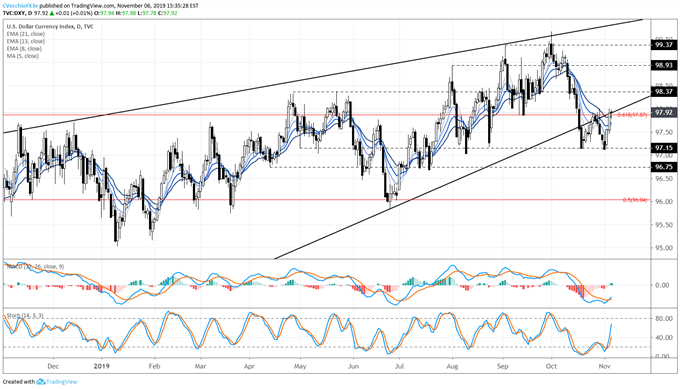
The US Dollar (via the DXY Index) is in the midst of an important recovery. The area where the DXY Index found resistance at the start of October was the trendline helping constitute resistance in the longer-term bearish rising wedge – an ominous topping pattern that persists.
But the DXY Index has returned to the same trendline once more, setting up an alternative scenario: a false bearish breakout. For now, the DXY Index’s momentum profile is rapidly shifting from bearish to neutral, if not almost outright bullish. Price is above the daily 5-, 8- 13-, and 21-EMA envelope, but the EMAs are still in bearish sequential order. Slow Stochastics have quickly moved above its median line, although daily MACD is still buried deep in bearish territory.
A close above 98.00, the October 30 bearish outside engulfing bar/key reversal high, would suggest that the downtrend experienced by the DXY Index since the start of October is finished.
USD/JPY RATE TECHNICAL ANALYSIS: DAILY CHART (NOVEMBER 2018 TO NOVEMBER 2019) (CHART 4)
(Click on image to enlarge)
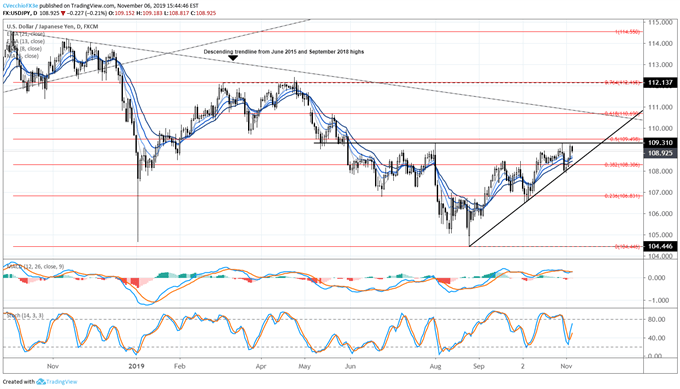
USD/JPY rates have been trading in an ascending triangle pattern since the end of May, and for like at the end of October, topside resistance is in focus once more. The area around 109.31/40 is critical. A close above 109.31 would clear out the August 1 bearish outside engulfing bar/key reversal, as well as the 50% retracement of the 2018 to 2019 high/low range near 109.40, would suggest that a bottom has been found.
Despite losses on the day, the daily 5-, 8-, 13-, and 21-EMA envelope is in bullish sequential order. Daily MACD is flat while holding in bullish territory, while Slow Stochastics have rebounded sharply in recent days back above its median line. Traders should be patient waiting for the bullish breakout potential; otherwise, the bear case would gain traction below the November monthly low, set on the first trading day of the month at 107.89.
IG CLIENT SENTIMENT INDEX: USD/JPY RATE FORECAST (NOVEMBER 6, 2019) (CHART 5)
(Click on image to enlarge)
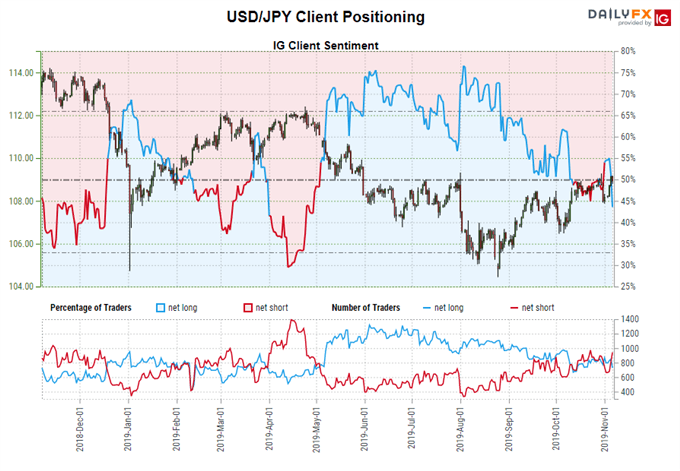
USD/JPY: Retail trader data shows 44.08% of traders are net-long with the ratio of traders short to long at 1.27 to 1. The number of traders net-long is 3.45% higher than yesterday and 9.87% lower from last week, while the number of traders net-short is 5.67% higher than yesterday and 6.74% higher from last week.
We typically take a contrarian view to crowd sentiment, and the fact traders are net-short suggests USD/JPY prices may continue to rise. Traders are further net-short than yesterday and last week, and the combination of current sentiment and recent changes gives us a stronger USD/JPY-bullish contrarian trading bias.


