
US Dollar Bulls Continue To Push As AUD/USD Crushed Through Support
US DOLLAR BULLS CONTINUE TO PUSH
The past week has produced a noticeable shift in US Dollar price action, as bulls have continued to drive after the currency posted a higher-low at the end of January. Prices have moved above the 96.04 level and are now heading for a test of a trend-line projection as taken from the December and late-January swing-highs. If buyers can push through that area, another point of resistance potential exists around 96.47, which is the 23.6% retracement of the post-Election move in the currency. After that, the 97.00 level becomes of interest, as the 2019 high is just a little below this psychological value on the chart.
US DOLLAR FOUR-HOUR PRICE CHART
(Click on image to enlarge)
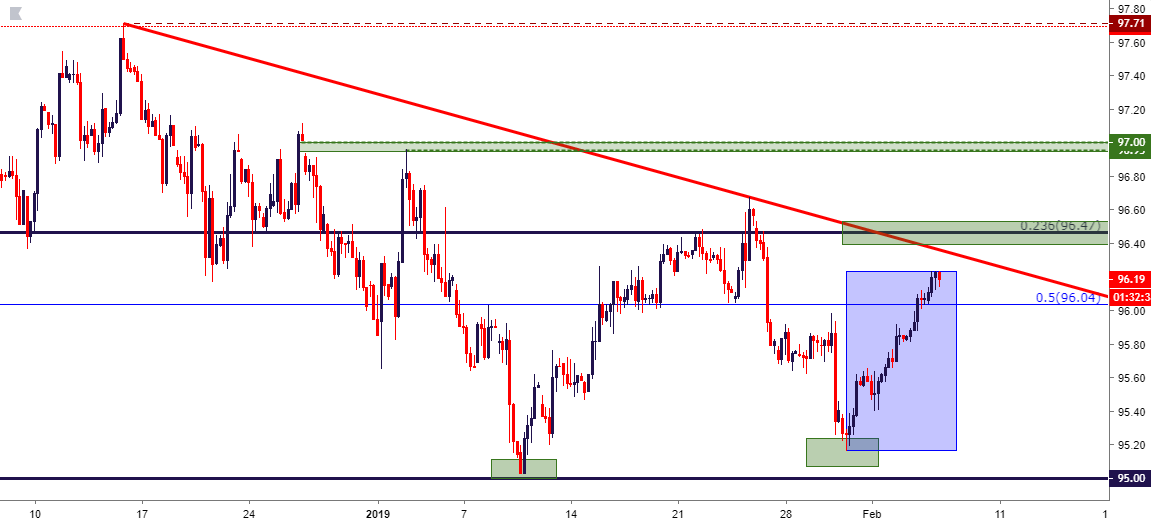
Chart prepared by James Stanley
AUD/USD BULLISH TREND BREAKS DOWN
The Australian Dollar exhibited a bullish reaction at a key area of support after the Monday night/Tuesday morning RBA rate decision. Prices jumped from the key zone that runs from .7185-.7205, soon finding resistance at a trend-line projection as taken from the January and February swing highs. This could be soon open the door to topside themes in the pair.
But last night produced a noticeable violation of that support zone, and that theme no longer looks as attractive. Phillip Lowe, the head of the RBA, remarked that lower rates may bring on a weaker Aussie, and this comes in contrast to the tone from the RBA rate decision just a day earlier in which the bank avoided any easing signals in their statement. At this point, support has come in from a familiar area of .7125; and a bit lower is another area of interest at .7075.
AUD/USD TWO-HOUR PRICE CHART
(Click on image to enlarge)
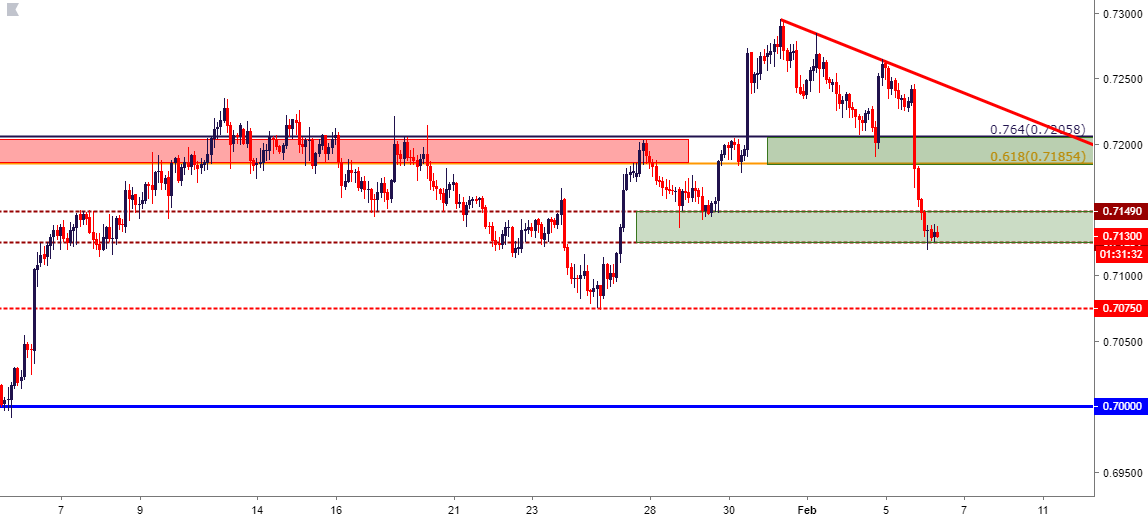
Chart prepared by James Stanley
EUR/USD TESTS BELOW 1.1400 AS SHORT-TERM DOWN-TREND CONTINUES
It’s been back-and-forth price action in EUR/USD over the past few months, and last week brought an item of excitement when the pair tested above the 1.1500 psychological level. That strength could not last, however, and bears soon came back to take control of matters. Since that failed breakout last Thursday, a rather consistent short-term trend has developed within this longer-term range; and this morning saw prices tip-toe below the 1.1400 level, setting a fresh weekly low in the process.
At this point, it can be difficult to project a break of the multi-month range, but for those looking at short-term strategies and/or ways of taking on long exposure to the US Dollar, this could remain an item of interest given the consistency with which this trend has priced-in.
EUR/USD EIGHT-HOUR PRICE CHART
(Click on image to enlarge)
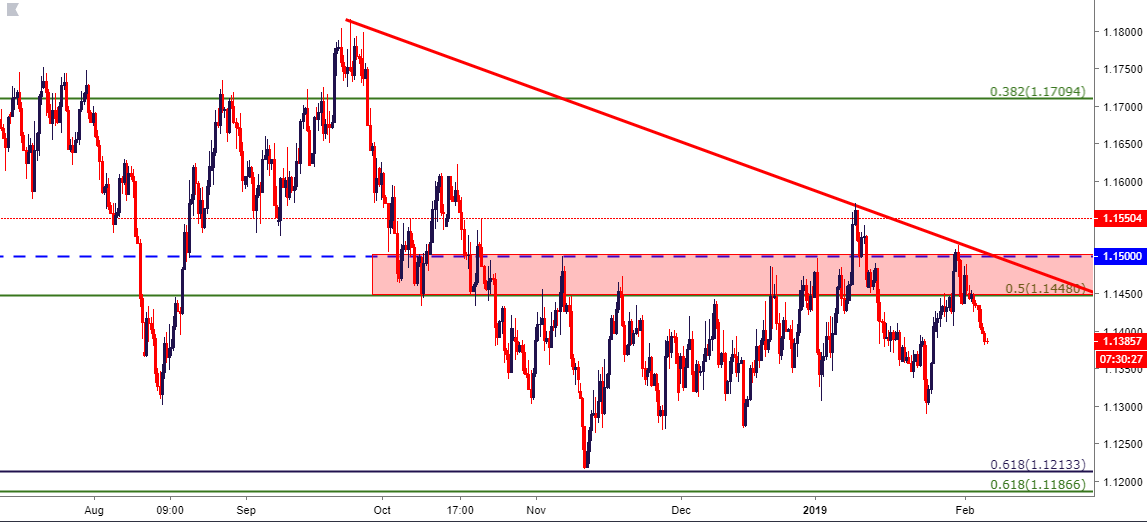
Chart prepared by James Stanley
GBP/USD: CABLE CATCHES SUPPORT, BUT CAN IT HOLD?
The British Pound caught another wave of weakness after the open of this week’s trade, and this comes in contrast to the pronounced bullish trend that developed in GBP/USD in the month of January. Last month didn’t start out that way, to be sure, as GBP/USD plunged down to a fresh 20-month low on January 3rd. But, that theme didn’t last for long, as short-cover soon turned into a topside rally that pushed the pair back up to the 1.3200 handle.
The past week has helped to soften that bullish theme, and as looked at yesterday, prices had dropped back below the vaulted 1.3000 level on the charts. Support soon developed around the 38.2% retracement of the January bullish move, and that level has held into this morning. There’s another support zone of interest a bit lower on the charts, running from the 50% retracement level of 1.2828 up to 1.2850.
GBP/USD EIGHT-HOUR PRICE CHART
(Click on image to enlarge)
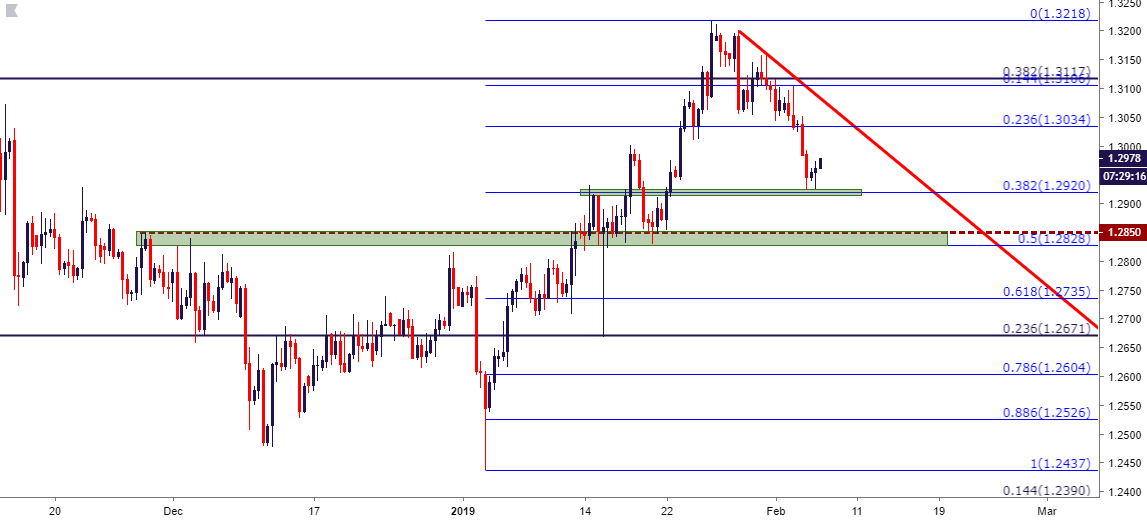
Chart prepared by James Stanley
USD/JPY RESISTANCE REMAINS AT 110.00 – CAN BULLS CONTINUE TO PUSH?
After a significant surge of strength to start the New Year, Yen weakness has come back as a rather visible theme across the FX-space. After USD/JPY tested below 105.00 on January 2nd, prices in the pair have continued to rally in a rather consistent fashion; but the 110.00 area is proving to be a tough area for bulls to take-on. This level has now held the highs for around two weeks over multiple tests; each of those resistance inflections appears to be carrying less weight, which could soon open the door to topside breakout potential.
USD/JPY FOUR-HOUR PRICE CHART
(Click on image to enlarge)
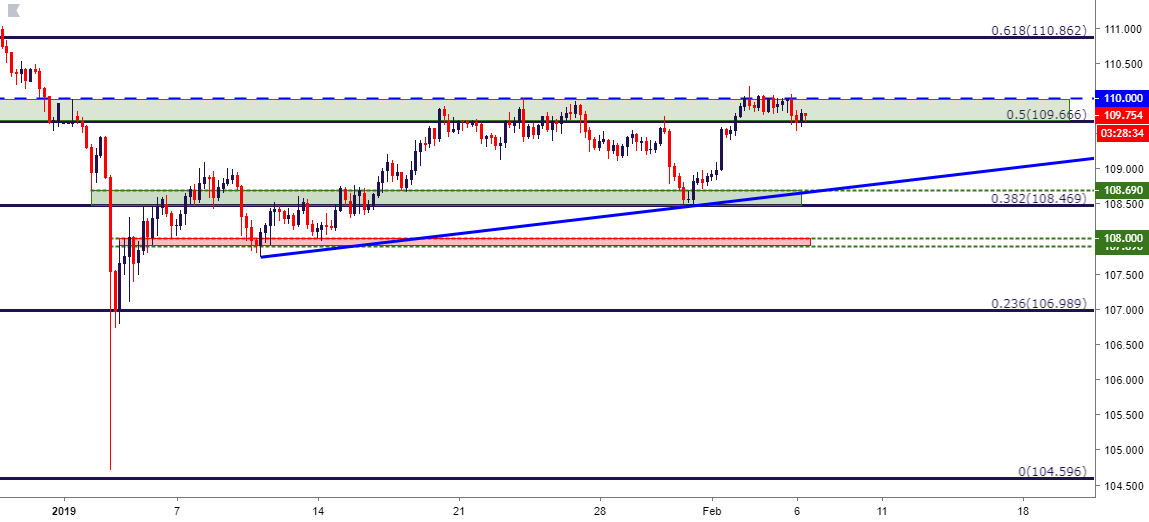
Chart prepared by James Stanley
Disclosure: Do you want to see how retail traders are currently trading the US Dollar? Check out our IG Client Sentiment ...
more

