
US Dollar Bounces From Support Ahead Of Busy Economic Calendar
US DOLLAR BOUNCES FROM SUPPORT TO START BIG WEEK
The US Dollar has started off the week by making a quick move down towards last week’s low, which came in at the 96.30 level in DXY. That low printed on Wednesday of last week, but buyers were unable to post much of an upward advance and another lower-high came-in around a prior area of support around the 96.68 level.
A number of USD drivers are on this week’s calendar, including the twice-annual Humphrey Hawkins testimony in which FOMC Chair, Jerome Powell, will address each arm of Congress. The big question around the US currency is whether USD bulls continue to take a break from the post-January FOMC bullish run; or whether buyers show back up to drive-up to resistance around 97.30 or, perhaps even the 97.71 level that marks the November/December double-top.
US DOLLAR HOURLY PRICE CHART
(Click on image to enlarge)
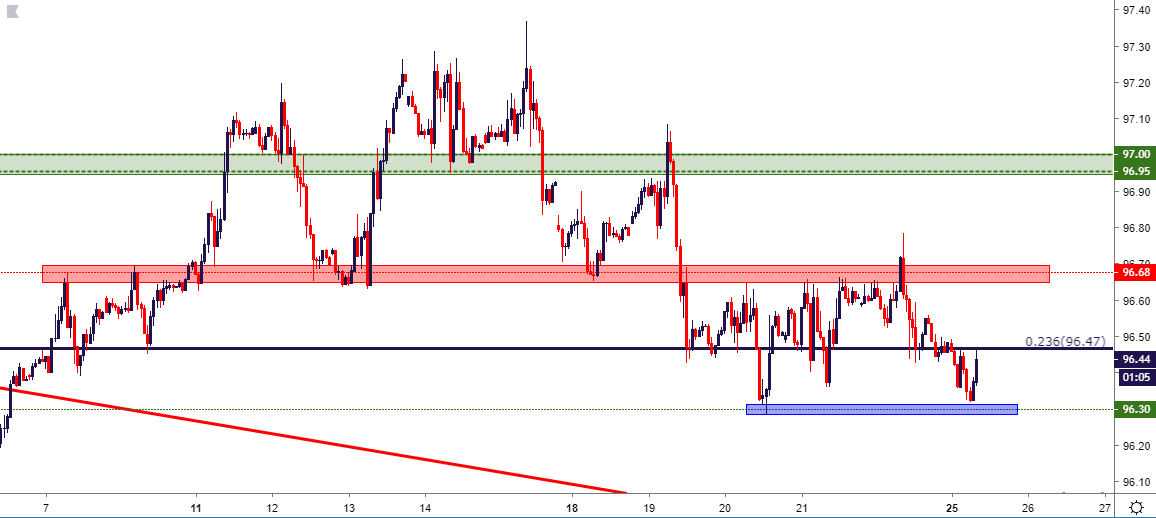
Chart prepared by James Stanley
As markets open this week, a number of drivers remain on the economic calendar, particularly around the United States. Tuesday and Wednesday of this week bring the twice-annual Humphrey Hawkins testimony with FOMC Chair, Jerome Powell. Mr. Powell will speak to the Senate Finance Committee on Tuesday and the House Financial Services Committee on Wednesday. Each day will begin with prepared remarks, at which point the floor will be opened to questions, and these questions can be very wide ranging with a variety of economic implications. Also, this week brings the Trump-Kim Summit in Hanoi, Vietnam, set to take place on Wednesday and Thursday. The result of this meeting could have trade war implications which can, in turn, create market volatility. Outside of the US, BoE Governor Mark Carney will address Parliament tomorrow morning at 5:00 AM ET, Canadian CPI numbers are released on Wednesday morning, and German CPI is released the morning after. The week closes with a batch of drivers on Friday morning, as German unemployment and Euro-Zone CPI are released at 3:55 and 5:00 AM ET, respectively, followed by Canadian GDP and US PCE.
DAILYFX ECONOMIC CALENDAR: HIGH-IMPACT FOR THE WEEK OF FEBRUARY 25, 2019
(Click on image to enlarge)

Chart prepared by James Stanley
EURUSD RANGE REMAINS – CAN BUYERS POSE A PUSH UP TO RESISTANCE?
Going along with that softening in the US Dollar’s January run has been a longer-term play of support in EURUSD. The pair has been range-bound since early-November and this range has held through a number of different drivers. Coming into last week, I looked at the topside of the range after the pair spent a week testing support; but buyers have thus far been unable to spark much strength above the 1.1360 area on the chart, with sellers showing some element of resistance last week each day Tuesday-Friday.
Can buyers finally pose a push up to the 1.1448-1.1500 resistance zone, which was last in-play a few weeks ago?
EURUSD DAILY PRICE CHART
(Click on image to enlarge)
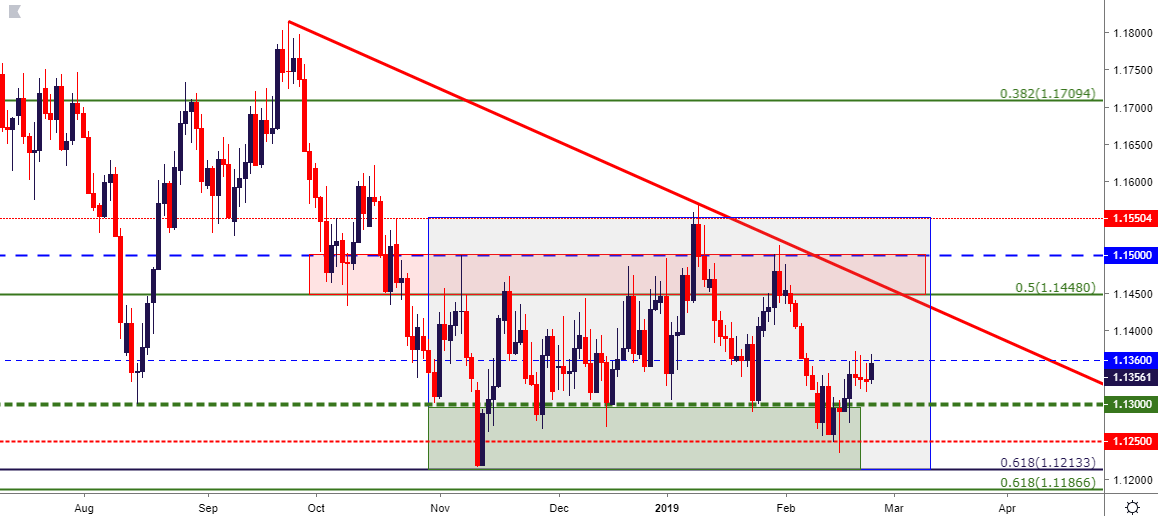
Chart prepared by James Stanley
USDJPY HOLDS FIBONACCI RESISTANCE
On the bullish side of the US Dollar, USDJPY remains of interest as the pair has continued to hold strength, even with the Dollar’s recent setbacks. This is indication of an even weaker Japanese Yen than what’s played out in USD of recent, and if Dollar-strength themes do come back, this could keep the topside of USDJPY as interesting.
The complication with the pair at the moment is one of price levels. The pair broke-out earlier this month to run to fresh 2019 highs above the 111.00 handle. Prices soon pulled back to find support around 110.30, at which point buyers pushed right back up to the Fibonacci level at 110.86. This can be a difficult area to line up fresh bullish exposure given the distance to support, but this does keep the pair as interesting as traders can look to work with either a) a bullish breakout to fresh highs, as looked at in this week’s FX Setups or b) a pullback to find support at a prior zone of key resistance (109.67-110.00).
USDJPY FOUR-HOUR PRICE CHART
(Click on image to enlarge)
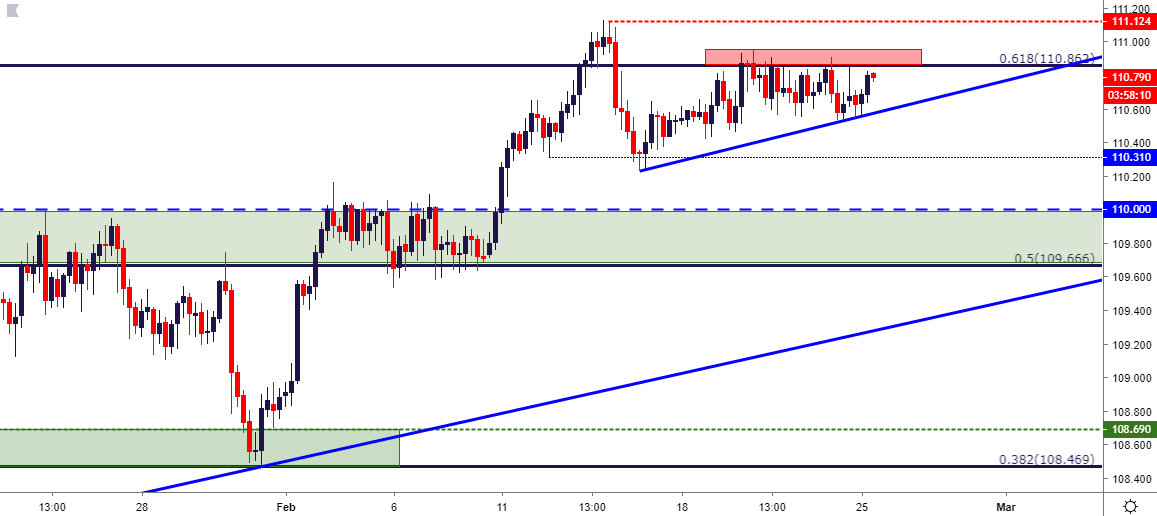
Chart prepared by James Stanley


