
US-China Trade Talks: No Solution In Sight
The US and China meet tomorrow in an attempt to cut a trade deal. But chances are that protectionism will get worse before it gets better. US demands are too ambitious for quick fixes. The negative effects of higher tariffs are starting to kick in and economic growth will not provide much support to world trade either. Trade growth will drop to 1.3% in 2019.

Source: Share
US-China trade talks: little chance for a deal before the 1 March deadline
US-China talks resumed on 7 January in Beijing with both sides positive about the prospects for a deal, continuing the constructive tone that had taken hold since the American and Chinese leaders agreed to a ceasefire at the beginning of December. But as we expected back then (see Don't cry victory yet), optimism has since faded. Although China has recently made some advances towards the US, the American wish list is very ambitious and wide-ranging. Alongside a much lower bilateral trade deficit, US negotiators are increasingly insisting on fundamental changes in China’s industrial policy ‘Made in China 2025’. More transparent foreign exchange operations and the value of the renminbi are on the list as well.
We don’t foresee a deal on all these issues being agreed before the deadline on 1 March. Just last week, US Commerce Secretary Wilbur Ross said the two sides were ”miles and miles away from a resolution”.
- So, in our base case, we expect the US to turn the heat on China by increasing tariffs on $200 billion of Chinese imports to 25% in 2Q from the 10% rate imposed in September.
- In a downside risk scenario, the US expands tariffs further in 3Q to Chinese imports which have not yet been hit by higher tariffs (around $260 billion worth of imports).
- On the other hand, an upside risk scenario could see Presidents Jinping and Trump reach a deal. China has already announced various policy aims of market-based reform and a rebalancing of its economy. So one route to a solution might involve China “announcing” a timetable of implementation (as seen in the 2018 announcement on liberalising the exchange rate and foreign investment regime) and agreeing to strengthen enforcement, with sanctions to be imposed in the case of no compliance. In this upside risk scenario, all tariff hikes from both sides thus far would be undone. That delivers a positive impulse of 0.6 percentage points for trade in 2019 (chart 1).
We think it is almost impossible to reach such a deal before 1 March. So, if the upside risk scenario happens at all, it would happen later (3Q we assume) after the US increases pressure in 2Q.
Chart 1: Effect of tariffs on world trade, three scenarios
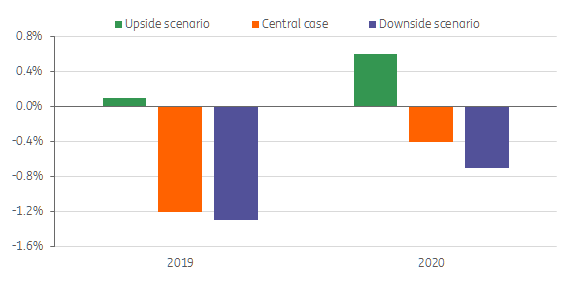
Source: ING
US-EU talks: the threat of auto tariffs
Aside from the US-China trade tensions, there is the imminent threat of tariff increases on US imports of cars and parts, some 3% of world trade. The US Department for Commerce has been conducting an investigation into the national security implications of importing cars and parts using the same procedure that led to the introduction of steel and aluminium tariffs in 2018.
Whether the report-to be published on 17 February at the latest- will find a national security threat is still unconfirmed, but it seems likely. President Trump will then have the option to raise tariffs.
Tariff increases on cars and parts are of particular concern to the EU, piling the pressure on the trade talks that are officially yet to begin. The US and EU have been engaged in talks since the summer, but not formal trade negotiations. On the EU side, member states need to agree on a mandate for the European Commission’s trade negotiators. The EU’s negotiating mandate is likely to be limited to reducing tariffs on industrial goods and trying to harmonise standards (technical, health and safety) for products to be sold within the EU.
The US negotiating objectives go much further than the agreed talks about tariffs on industrial goods and product standards, raising issues that proved to be deal-breakers for TTIP, including improving market access for US agricultural goods (chlorinated chicken etc). The gap between the US objectives and the mandate that the EU negotiators will bring to the talks may be too large for a deal to be done. So, in our base case, we expect US import tariffs on autos to be raised during the second half of 2019 without exempting the EU.
WTO dispute settlement on borrowed time
In the meantime, various countries have filed complaints at the WTO about protectionist measures taken in 2018, like the tariff increases on steel and aluminium. But the WTO’s appeals court is on borrowed time and may be unable to hear appeals in 2019. The court will fall below the minimum number of judges as soon as a dispute involving one or more of the judges’ countries of nationality (China, India and the US) is referred to the court.
What's more, two of the judges will reach the end of their terms in December with little prospect of having these terms extended, or of new appointees taking their place. The US has refused to appoint new judges since 2016 in protest against previous rulings. It argues that the court is changing the rules of international trade to the disadvantage of WTO members, without allowing them a say.
Trade faces an uncertain future without this court. If the court is unable to hear appeals, any actions that have broken the international trade rules will stay in place, continuing to damage international trade, and setting precedents for further tariff increases.
Trade growth: higher tariffs are starting to bite
World trade growth slowed in 2018. We expect global goods trade to end 2018 with a year-on-year growth rate of 3.2%, considerably lower than the strong growth of 4.7% in 2017. Trade growth has increasingly been suppressed by the effects of the trade war. The conflict has made its presence felt through different channels.
Firstly at the firm and industry level. The direct effect of tariff hikes on the aggregate level of trade has thus far been limited partly because quite a few American companies that need intermediates from China successfully requested tariff exemptions for imports of thousands of products. Nevertheless, for some bilateral trade flows and for trade performance at the industry level, significant effects are visible. China’s imports of soybeans, for example, are still some 40% lower than this time last year.
It is also important to realise that many products that are hit by tariff hikes are intermediate products. If they become more expensive, prices of other products can rise as well.
Secondly, and probably of significant importance, tariff increases are playing a role in declining business confidence and putting a brake on investment growth.
Underlying trade growth
But more has been at play than the effects of the trade war. Moderation of trade growth in 2018 is in part a return to the ‘normal’ rate of growth after 2017 when trade growth outpaced by far the growth of world GDP and the growth of global industrial production. The slowdown of industrial production growth itself also put a brake on trade growth in 2018.
- Underlying this is the fact that growth in the economy generates less world trade than in the fifteen years running up to the crisis when the rate of trade growth was almost twice that of real GDP. Structural changes in the world economy are responsible for this. Emerging economies are increasingly consumption- rather than export and investment-driven, and therefore less import-intensive. These economies consume more of what they produce, rather than exporting it.
- Secondly, as we have stressed in earlier notes (see for example Trade nowhere close to its heyday), global value chains are not the driver of trade growth that they once were. Flows of foreign direct investment (FDI) and other indicators suggest that value chains are no longer expanding at their pre-crisis rates. The global value of greenfield FDI picked up slightly in 2018 relative to 2017 but remains at a lower level than pre-crisis (Chart 2). Differences in labour costs have become less pronounced across countries, partly thanks to automation. This is one of the reasons for the decreasing incentive of offshoring.
- Third, due to the changes in these underlying drivers, China’s contribution to world trade growth, worth around 1.5 percentage point each year from 2000-2010, but falling to less than half of that in 2011-2017, is likely to shrink further. China is pursuing a policy of self-sufficiency and rebalancing away from exports and investments towards consumption, which implies less growth of imports and exports.
The effects of longer-term initiatives like ‘Made in China 2025’ and especially the ‘Belt and Road Initiative’ may be somewhat offsetting in their effects on world trade, with the former aimed at moving China’s position within value chains towards higher value-added activities, and the latter facilitating international trade. In the near term, however, it is the slowdown in China’s growth which will dominate other factors to drive weaker growth in world trade.
Chart 2: World wide cross border greenfield investment flows, (2003-2018)
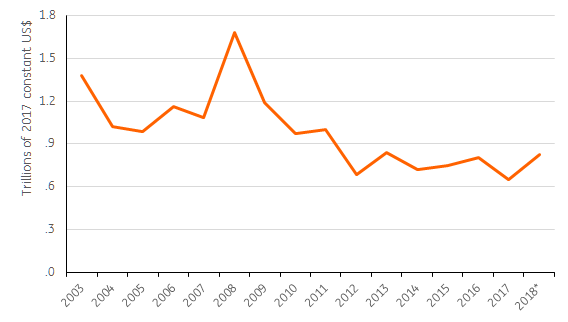
Source: ING calculations, data from FDintelligence and IHS-Markit
Data in constant 2017 USD. Nominal greenfield FDI is sourced from FDintelligence and deflated with dollar based ‘investment deflators’ from IHS - Markit. If no deflator was available, average Local Currency Unit based ‘investment deflators’ of peer countries were used in combination with the country specific exchange rate to transform the greenfield FDI flows to constant dollars. In specific cases of hyperinflation or socio-economic unrest (eg. Venezuela, Syria, and South Sudan), assets are assumed to be fully dollar denominated. For these countries, FDI flows have not been adjusted.
Trade outlook for 2019 and 2020
The outlook for global growth in 2019 and 2020 is rather gloomy with a growth figure of 1.3% this year and 2.3% next year. Due to a further moderation of production growth, support for trade from the economy this year will be only a little over half the support given in 2018, according to our model.
Add to this the negative effect of the trade war on trade growth, which will be almost three times as large as last year, and the collapse of trade growth is largely explained. After 2020, trade volume growth should recover again towards its 2011-17 average of 2.7%, if tariffs are not increased further.
Our upside and downside scenarios imply different paths for trade growth. The trade conflict might come to an end or escalate further than we currently expect. In the downside scenario, trade growth is close to 1%, while in the upward risk scenario, trade growth is about twice as high, stressing the fact that in 2019 the effects of the trade dispute really make a difference (Chart 3).
Chart 3: World trade growth 2017-2020, three scenarios
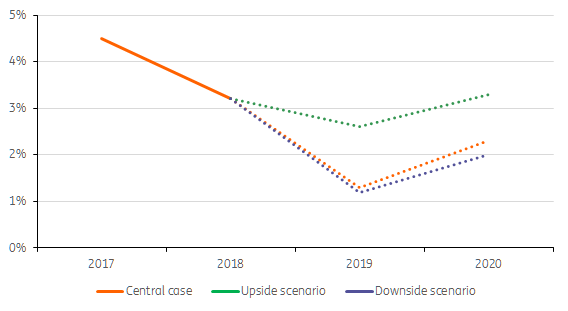
Source: ING
Disclaimer: This publication has been prepared by ING solely for information purposes irrespective of a particular user's means, financial situation or investment objectives. The information does ...
more


The world will have no choice but to unite against the USA. There is evidence this is happening. Trump is playing with fire and the risk of America being burned is increasing.