
US Business Cycle Risk Report - Tuesday, August 20
Recession forecasts have been mounting lately, largely due to inverted yield curves. But a broad read on the hard data has yet to throw in the towel. US economic growth is slow and may get slower in the months ahead, but for the moment the odds still favor expansion for the immediate future.
The current macro profile for the US is basically unchanged from last month’s update. On a positive note, all of the positive trending indicators tracked on these pages in June remained positive in July and one formerly negative trending time series strengthened last month. For the first time this year, newly issued housing permits posted a one-year increase last month (see table below). That’s a small change, but it could be a sign that the housing sector will stabilize or perhaps even rebound in the months ahead. If so, a firmer trend will provide some much-needed support for the economy.

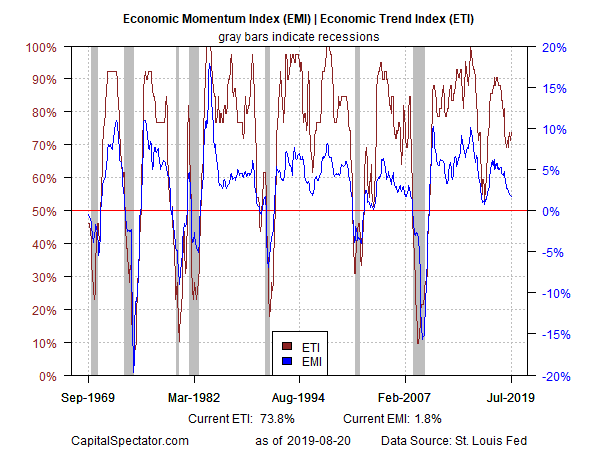
For additional context, consider the aggregated profile of the indicators in the table above via two benchmarks. The firmer trend in permits lifted the Economic Trend Index (ETI) – a business-cycle index that tracks 14 indicators that collectively capture a broad snapshot of US economic activity. ETI ticked up to 73.8% in July, indicating a slightly stronger expansion that matches May’s level as the highest print for the year to date (red line in chart below). By contrast, filtering the same data set through another econometric lens – the Economic Momentum Index (EMI) – continues to reflect a weakening trend. EMI’s current 1.8% print marks the lowest level since 2016 (blue line). Both indicators remain comfortably above their respective tipping points that mark recession (50% for ETI and 0% for EMI), but the mixed messages on-trend and the generally diminished levels vs. recent history are reminders that the economy’s outlook is open for debate. (For details on the design and interpretation of ETI and EMI, see my book on monitoring the business cycle.)
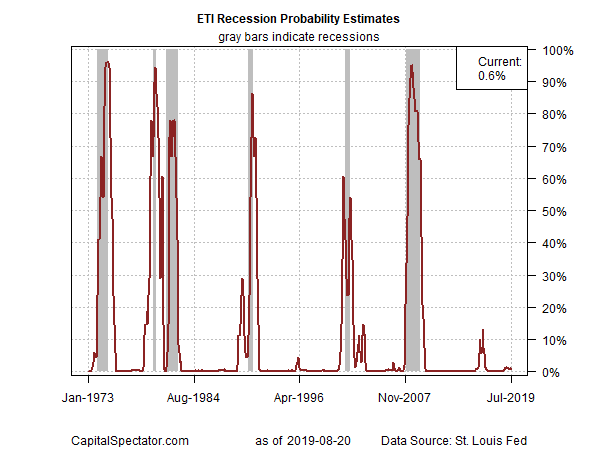
Using the data published to date for ETI continues to offer a strong sign that recession risk remains low… so far. Translating the index’s historical values into recession-risk probabilities with a probit model points to low business-cycle risk for the US through last month. Analysis through this lens indicates that the odds remain virtually nil — less than 1% — that NBER will declare July as the start of a new recession. Note, too, that a probit-model reading of EMI (not shown) also shows a low probability (6%) that the economy was contracting last month.
Turning to the near-term outlook, consider how ETI may evolve as new data is published. One way to project values for this index is with an econometric technique known as an autoregressive integrated moving average (ARIMA) model, based on default calculations via the “forecast” package in R. The ARIMA model calculates the missing data points for each indicator for each month — in this case through September 2019. (Note that May 2019 is currently the latest month with a complete set of published data for ETI.) Based on today’s projections, ETI is expected to tick lower for a second month in September, albeit to a level that still reflects modest but weakening economic growth.

Forecasts are always suspect, but recent projections of ETI for the near-term future have proven to be reliable guesstimates vs. the full set of published numbers that followed. That’s not surprising, given ETI’s design to capture the broad trend based across multiple indicators. Predicting individual components in isolation, by contrast, is subject to greater uncertainty. The assumption here is that while anyone forecast for a given indicator will likely be wrong, the errors may cancel out to some degree by aggregating a broad set of predictions. That’s a reasonable view, based on the generally accurate historical record for the ETI forecasts in recent years.
The current projections (the four black dots in the chart immediately above) suggest that the economy will continue to expand through next month, albeit at a sluggish pace. The chart also shows the range of vintage ETI projections published on these pages in previous months (blue bars), which you can compare with the actual data (red dots) that followed, based on current numbers.
For more perspective on the track record of the ETI forecasts, here are the vintage projections for the past three months:
18 July 2019
19 June 2019
21 May 2019
Note: ETI is a diffusion index (i.e., an index that tracks the proportion of components with positive values) for the 14 leading/coincident indicators listed in the table above. ETI values reflect the 3-month average of the transformation rules defined in the table. EMI measures the same set of indicators/transformation rules based on the 3-month average of the median monthly percentage change for the 14 indicators. For purposes of filling in the missing data points in recent history and projecting ETI and EMI values, the missing data points are estimated with an ARIMA model.
Disclosure: None.


