
US Business Cycle Risk Report - Friday, Jan. 18
The odds are still low that a new US recession has started, but economic momentum continues to slow. The headwinds remain moderate so far, but the potential for trouble later in the year is rising, in part due to the partial government shutdown.
US economic activity was already decelerating before the political stalemate began late last month. In early December, for instance, The Capital Spectator reported that gross domestic product (GDP) in the fourth-quarter was on track to post a moderately softer growth rate vs. Q3. This week’s update of the Q4 outlook still reflects a slowdown, although the estimated 2.8% increase suggests that the economy ended the year with a decent tailwind.
Today’s economic profile continues to reflect low recession risk, but the combination of a decelerating macro trend that began in last year’s second half and the ongoing government shutdown imply that output will remain on downward trajectory for the near term.
Meantime, economic analysis will become increasingly challenges because key economic reports are no longer being updated, courtesy of the political chaos in Washington. This week’s scheduled retail sales and housing starts for December, for example, remain a mystery. (Housing data from BuildFax suggests that residential construction fell last month.) To fill in the missing data points until the government resumes its regular economic updates The Capital Spectator will rely on estimates generated by an ARIMA model.
Meanwhile, the available numbers still point to a positive but slowing economic trend. A broad set of indicators reflects a virtually nil probability that a new NBER-defined downturn began in December. (For a more comprehensive review of the macro trend with weekly updates, see The US Business Cycle Risk Report.)
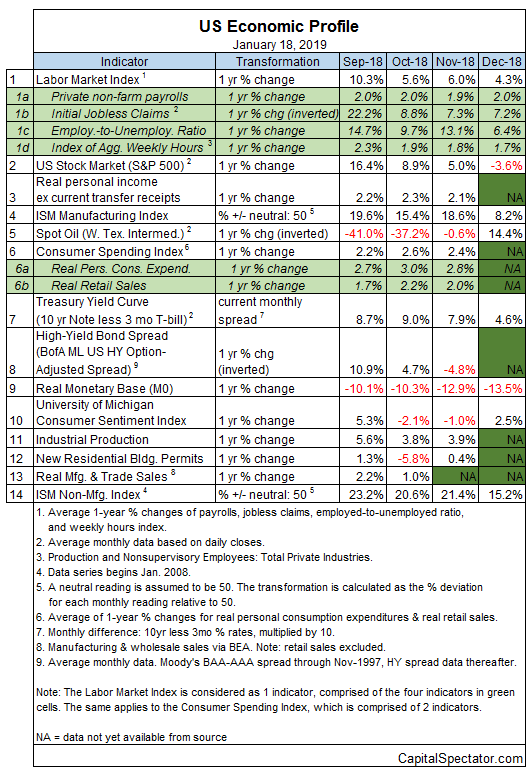
Aggregating the data in the table above continues to indicate a growth trend overall through last month, although the strength of the expansion weakened — again — in December. Despite the deceleration, the Economic Trend and Momentum indices (ETI and EMI, respectively) remain moderately above their respective danger zones (50% for ETI and 0% for EMI). When/if the indexes fall below those tipping points, the declines will mark warning signs that recession risk is elevated and a new downturn has started or is near. The analysis is based on a methodology that’s outlined in my book on monitoring the business cycle.
Although ETI and EMI remain in positive terrain, both indexes have been slipping in recent history, as shown in the chart below. The deceleration may run its course at some point and stabilize, but for the moment the published numbers suggest that a downside bias still prevails.

Translating ETI’s historical values into recession-risk probabilities via a probit model points to low business-cycle risk for the US through last month. Analyzing the data in this framework indicates that the odds remain close to zero that NBER will declare December as the start of a new recession.

For the near-term outlook, consider how ETI may evolve as new data is published. One way to project values for this index is with an econometric technique known as an autoregressive integrated moving average (ARIMA) model, based on calculations via the “forecast” package in R. The ARIMA model calculates the missing data points for each indicator for each month — in this case through January 2019. (Note that October 2018 is currently the latest month with a complete set of published data for ETI.) Based on today’s projections, ETI is expected to remain above its danger zone through next month. Keep in mind, however, that the ongoing slide in ETI warrants close monitoring because the possibility exists that the index will fall through the critical 50% mark at some point in 2019, a slide that would indicate the start of a new NBER-defined recession.

Forecasts are always suspect, but recent projections of ETI for the near-term future have proven to be reliable guesstimates vs. the full set of published numbers that followed. That’s not surprising, given ETI’s design to capture the broad trend based on multiple indicators. Predicting individual components, by contrast, is subject to greater uncertainty. The assumption here is that while any one forecast for a given indicator will likely be wrong, the errors may cancel out to some degree by aggregating a broad set of predictions. That’s a reasonable view, based on the generally accurate historical record for the ETI forecasts in recent years.
The current projections (the four black dots in the chart above) suggest that the economy will continue to expand in the immediate future. The chart also shows the range of vintage ETI projections published on these pages in previous months (blue bars), which you can compare with the actual data (red dots) that followed, based on current numbers.
For more perspective on the track record of the ETI forecasts, here are the vintage projections in the past three months:
21 December 2018
23 November 2018
19 October 2018
Note: ETI is a diffusion index (i.e., an index that tracks the proportion of components with positive values) for the 14 leading/coincident indicators listed in the table above. ETI values reflect the 3-month average of the transformation rules defined in the table. EMI measures the same set of indicators/transformation rules based on the 3-month average of the median monthly percentage change for the 14 indicators. For purposes of filling in the missing data points in recent history and projecting ETI and EMI values, the missing data points are estimated with an ARIMA model.
Disclosure: None.


