
Tuesday Talk: Cowabunga - What A Market!
Over the weekend many pundits were predicting a sideways trading week in the aftermath of the FOMC meeting, but Monday the market rebounded with a roar. Yesterday the S&P gained 58 points to close at 4,225, the Dow Jones Average was up 587 points, closing at 33,877 and the Nasdaq Composite gained 111 points, closing at 14, 141. Currently, futures for all three indices are trading up, ever so slightly.

This week Alex Barrow in a TalkMarkets Editor's Choice column notes that it's Time To Yen…. He covers the story in charts 10, 11 and 12 of his "Dirty Dozen" chart pack, but here is the drift:
"The Japanese yen (FXY) looks interesting for a long here. Our CoT oscillator shows short-term positioning and seasonality (both 5 and 30-year) are favorable. JPY/USD 10-year differentials are beginning to move in the yen’s favor. Momentum has bottomed out (and the chart shows) a potential double bottom in place. I wouldn’t play it against the dollar, which itself looks set for a sizable position-driven bounce. Short EUR/JPY though has a great chart and the euro has crowded longs to work off."
With regards to the stock market, this week Barrow notes the following:
"We’re entertaining two macro takes right now (1) the market is about to roll over into a couple of months of sideways chop and vol summer doldrums style or (2) market rips higher first, led by growth, and then rolls over and enters an extended range." and "All Star Charts show that year 2 of a bull is often an extended period of consolidation."

As we approach the end of the second quarter TalkMarkets contributor Sheraz Mian takes another look at Making Sense Of Q2 Earnings Season Expectations.
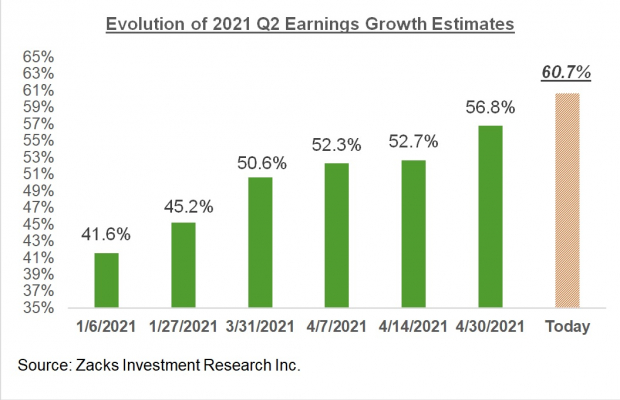
"Estimates have been steadily going up, as we have been consistently pointing out in our earnings commentary, though the favorable revisions trend has eased off in recent weeks. Given how strong earnings surprises turned out to be in the preceding reporting cycle (2021 Q1), the final earnings growth tally for 2021 Q2 could be as high as +80%. The chart below shows earnings growth expectations for 2021 Q2 have changed since early January:"
Mian's article contains several charts and assessments worth looking at, but the important takeaway is that the economy is experiencing real growth sans the COVID recovery rebound.
"In fact, 9 of the 16 (Zacks Investment Research) sectors are expected to earn more in 2021 Q2 than they did in the pre-COVID 2019 Q2 period. These sectors include Basic Materials (+74.1% higher earnings relative to the 2019 period), Construction (+56.9%), Technology (+31.7%), Retail (+24.7%), and Medical (+20.9%). Even the Finance sector is expected to have +5.4% higher earnings in 2021 Q2 relative to Q2 2019.
Transportation, Consumer Discretionary, Energy, Aerospace and Autos are some of the major sectors that are expected to earn significantly less than what they earned in the comparable 2019 period.
The bottom line is that while comparisons to the COVID-affected 2019 period is no doubt giving us the outsized growth pace in 2021 Q2 (+60.1%), growth would still be positive without such a base-year effect."
In other spheres the volatility in cryptoassets continues with China's sudden crackdown on Bitcoin (BITCOMP) mining being the latest disruption in that market. This morning Mish Shedlock presents some of the details in his article China Tells Its Banks To Not Settle Bitcoin Transactions, Shuts Down Mining.
"Last Friday, China clamped down Bitcoin mining operations. By Sunday, over 90% of China's Bitcoin Mining capacity was off.
This is just the start of what I long ago suggested would happen.
For now, the implied effect may be limited. Chinese citizens can create bank accounts outside China to settle transactions.
And mining is still happening in the rest of the world.
However, the psychological impact could be greater than what we see on the surface.
Big Questions
- How long will the rest of the world will put up with massive amounts of energy devoted to mining cryptos?
- How long before another major country acts to halt Bitcoin transactions.
If the US were ever to crack down on Bitcoin transactions, it would be an immediate light out for valuation.
A very steep tax on Bitcoin mining could also have a steep impact.
China is only the opening salvo. "

The chart is showing a triple bottom in one month. Check out the article for additional commentary and links and be careful out there in the mines.
The Staff at Macro-View.com writing in their article U.S Dollar, Will The Rise Continue? presents some no-nonsense statistics about their expectations for the dollar. Inflation is expected to taper off and the dollar is expected to strengthen.
"The U.S Dollar has a strong inverted correlation with headline inflation in terms of a year-over-year percentage change. The daily trade-weighted U.S Dollar (has started) retracing upward as inflation is highly expected to decelerate in the coming quarter."
See the chart below:

TalkMarkets contributor Tyler Durden notes that Taiwan Semiconductor (TSM) can now be considered the single most important chip manufacturer as relates to the current economic recovery. Writing in Meet The One Chipmaker The Entire World Is Now Depending On he makes the following observations:
"Not only has TSMC made headlines for proposing to expand production into the United States, as we have documented numerous times, but now it is making headlines for how it has become the center of the semiconductor world - and how that can leave the world vulnerable.
TSMC's chips are in "billion of products", including iPhones, computers, and cars, the Wall Street Journal writes in a new profile of the company. The company has slowly become the world's 11th most valuable company, with a market cap of about $550 billion. The company reported $17.6 billion in profits last year on revenues of about $45.5 billion. TSMC makes "around 92% of the world's most sophisticated chips," the report says."
The below chart shows how TSMC stacks up against its competition.
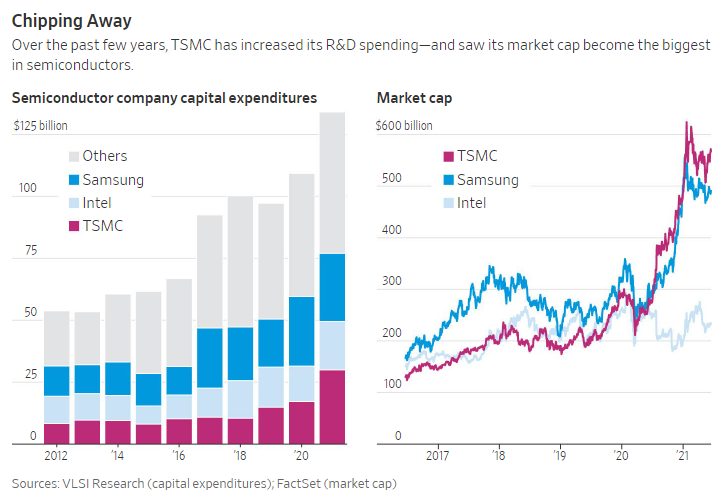
Read the full article for news of how TSMC is preparing to challenge Intel and Samsung further, including its plans for expansion in Arizona.

Contributor Sweta Killa closes out today's column with some ETF suggestions for investing in volatile times in an article entitled, 4 ETF Zones To Invest In As Volatility Spikes.
"Earlier-than-expected tightening ( by the Fed) has prompted investors to re-access their portfolio, leading to higher demand for lower-risk securities. As a result, we have highlighted four such zones and their popular ETFs where investors could stash their money amid this volatility:
Low Volatility - iShares Edge MSCI Min Vol USA ETF (USMV)
Low-volatility ETFs have the potential to outpace the broader market in an uncertain market environment, providing significant protection to the portfolio. This is because these funds include more stable stocks that have experienced the least price movement in their portfolio. Further, these allocate more to the defensive sectors that usually have a higher distribution yield than the broader markets.
USMV with AUM of $27.4 billion and an average daily volume of 3 million shares is the most popular ETF. The fund charges 15 bps in annual fees and has a Zacks ETF Rank #3 (Hold) with a Medium risk outlook.
Quality - iShares Edge MSCI USA Quality Factor ETF (QUAL)
Quality stocks are rich in value characteristics with a healthy balance sheet, high return on capital, low volatility, elevated margins, and a track of stable or rising sales and earnings growth. These products thus reduce volatility when compared to plain vanilla funds and hold up rather well during market swings.
With AUM of $21 billion, this fund provides exposure to large and mid-cap stocks exhibiting positive fundamentals (high return on equity, stable year-over-year earnings growth, and low financial leverage) by tracking the MSCI USA Sector Neutral Quality Index and holds 125 stocks in its basket. The ETF charges 15 bps in annual fees and trades in an average daily volume of 911,000 shares.
Value – Vanguard Value ETF (VTV)
Value stocks have proven to be outperformers over the long term and are less susceptible to trending markets. These stocks have strong fundamentals — earnings, dividends, book value, and cash flow — that trade below their intrinsic value and are undervalued. These have the potential to deliver higher returns and exhibit lower volatility compared with their growth and blend counterparts.
This fund targets the value segment of the broad U.S. stock market and follows the CRSP US Large Cap Value Index. It holds 338 stocks in its basket with AUM of $83.5 billion and charges 4 bps in annual fees. The ETF trades in volume of 2.8 million shares per day on average and has a Zacks ETF Rank #1 (Strong Buy) with a Medium risk outlook.
Dividend - Vanguard Dividend Appreciation ETF (VIG)
The dividend-paying securities are the major sources of consistent income for investors when returns from the equity market are at risk. This is especially true as these stocks offer the best of both these worlds — safety in the form of payouts and stability in the form of mature companies that are less volatile to large swings in stock prices. The companies that offer dividends generally act as a hedge against economic uncertainty and provide downside protection by offering outsized payouts or sizable yields on a regular basis.
While the dividend space has been crowded, ETFs with stocks having a strong history of dividend growth like VIG seem to be good picks. The ETF has AUM of $59.2 billion and trades in volume of 1.2 million shares a day on average. It charges 6 bps in annual fees and has a Zacks ETF Rank #1 with a Medium risk outlook.
As always, Caveat Emptor.
Have a good week.


