
True Risk-Off Returns, Stubbornly Strong USD
Quick Take
The equity market has shown some credible technical cracks, and since the pendulum was in a transition from ‘risk-on’ dynamics into cloudier terrains, that’s all it took for the likes of the Yen and the USD to top the leaderboard.
The rise in the US Dollar portrays a disturbing theme, that is, there is ample demand for the currency in part as a function of the very limited alternatives to diversify one’s currency portfolios. That’s one way to rationalize how the US Dollar keeps strengthening amid the constant bleeding in US yields. Spoiler: All economies show the same gloomy tendencies.
Make no mistake, the yield curve trends in developed economies are absolutely terrible. It essentially communicates that in the grand scheme of things, there is a firm conviction by bond traders that the slowdown in China and the expected deceleration in US growth (ongoing in the EU) is spreading out to affect the outlook for growth and interest rates across the globe. This week, the admissions by the RBA prove my point, with horrible ramification for the Aussie, as the Central Bank finally comes to grips with the new reality in the Australian economy, one characterized by falling house prices hitting the real economy (consumption, business conditions, credit tightness, …)
The script, ever since the Dec Fed Put (hint at ending QT) has followed its course, with the ECB next to cave in by acknowledging its poor outlook, and this week, it’s been the turn of the RBA. On the background, you also have the PBOC injecting aggressive amounts of liquidity into the system.
There are 2 key drivers keeping markets afloat this year. One is the prognosis that excessive liquidity will ultimately be maintained into the system, while in parallel, the US and China must keep the hopes high that a trade deal will ultimately come to fruition.
The gravitation towards risk aversion on Thursday harbingers that the market is assigning way more question marks to an eventual trade deal than previously anticipated. Reports that Trump won’t meet Xi ahead of the March 1st tariff increase deadline has definitely moved the needle. It’s far from being baked in the cake and that’s translated in the behavior of financial markets.
Narrative In Financial Markets
- Reports emerged on Thursday that a much-awaited Trump-Xi meeting ahead of the March 1st deadline won’t be happening. The widely held belief is that a trade deal won’t be formalized unless the two leaders meet beforehand, so understandably, the markets seem to have entered into a bit of a panic mode by pricing in more uncertainty on the trade deal.
- To make matters worse for the negative rhetoric surrounding the US-China trade talks, Larry Kudlow, Direction of the US National Economic Council, said that there is a sizeable distance before they reach consensus. The comments acted as a catalyst to see further selling in US stocks, which further anchors the belief that any Sino-US trade headlines with sufficient substance to latch on is acting as the number 1 driver.
- EU’s Tusk said that the letter by UK’s Labour Leader Corbyn has some merits as a foundation from which to re-negotiate some of the clauses in the divorce agreement. The BBC reports about the story and what are the 5 Labour demands for supporting a Brexit deal. There might be light at the end of the tunnel after all, even if the move is highly costly for UK PM May’s popularity amongst some sectors of her own Conservative party. In a tweet on Thursday, EU’s Tusk said there is still no breakthrough in the negotiations with talks ongoing.
- The BoE left rates unchanged at 0.75% by unanimous decision. The accompanying monetary policy statement came on the dovish side by slashing GDP growth forecasts and inflation estimates, by reiterating that policy normalization remains conditioned by the Brexit situation. BoE’s Governor Carney press conference failed to ignite any major surprises we didn’t already know. Poor Carney sound like a broken record with his hands tied until Brexit clears up.
- The European Commission cut the EZ GDP growth estimate for 2019 by a significant margin from 1.3% to 1.9% as part of its latest economic forecasts report of the region. There were lower revision across the board, led by Germany and France. By now it should not be a surprise as the slow down has been very well telegraphed and this feels like old news.
- The ECB published its economic bulletin of the Jan monetary policy meeting, highlighting that incoming information about the EZ activity has surprised to the downside and risk are increasing due to a moderation in global growth momentum. The bulletin also contained a rather cloudy outlook for inflation expectations due to lower energy prices.
- I lost count of the number of times since December that I had to mention yet another miss in German economic data. Dec’s industrial production came at -0.4% vs +0.8% exp. This is the engine of growth in Europe we are talking about, which means that if the data has been so poor, which has led to call for a recession in H2, there are two key takeaways. Firstly, be skeptical of any normalization of policies by the ECB in 2019, in other words, a rate hike looks like an unrealistic expectation. Secondly, given the very strong ties between Germany and China, it strengthens the case even further that the slowdown in China goes far and deep.
- The RBA monetary policy statement slashed its growth forecast by 0.75bp from 3.25% down to 2.5%. Today’s statement, with more detailed information and full updated forecasts, offers a deeper look into the Australian economy and reflects the weakening trends in the country.
Potential Drivers — Economic Calendar
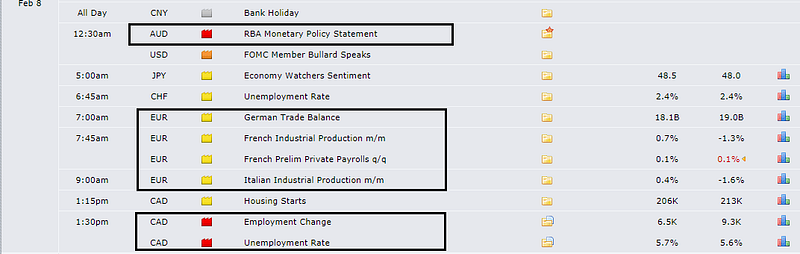
The German trade balance alongside industrial production figures in the EZ peripheral countries may provide further evidence, even if the trend is as clear as it gets, over the state of the Eurozone economy. I’ll be especially interested in the composition of the German trade (imports/exports) as it can shed further light on the global slowdown situation.
In Canada, we get the Jan jobs numbers, with both the headline change and the jobless rate expected to deteriorate. If expectations come true, there is going to be no incentives for the Bank of Canada to shift its ‘wait and see’ rhetoric unless wage growth picks up momentum, which helps drive further consumption activity in order to achieve the Bank’s 2% inflation mandate.
RORO Model: Risk-On Risk-Off Conditions
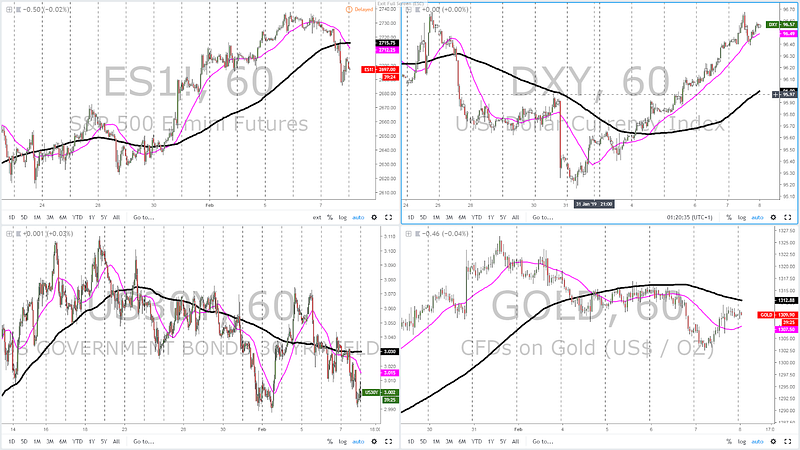
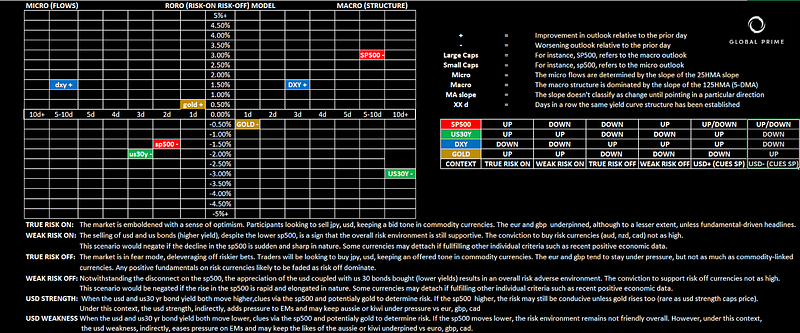
We’ve transitioned quite rapidly from a ‘weak risk-off’ profile into a full-blown ‘true risk-off’ as both US equities and US yields drop in tandem. The market is clearly growing impatient over the lack of progress in the US-Sino trade negotiations, with the Trump-Xi meeting cancellation a bad augur. The microdynamics via the slope of the 25-HMA are finally all in alignment to classify the current movements as part of a clear risk-off context.
It could get worse if another negative day in the S&P 500 eventuates, as it would take the macrostructure into ‘true risk-off’ conditions. We are not there yet but that’s the final straw to break the 2019 risk rally in the markets. Once the micro and macro converge together, it won’t be time for complacency but to play defensive and expect the JPY to fare better performances.
What’s interesting about Thursday’s risk profile is that even as the USD strengthened across the board (exc GBP), the price of gold managed to eke out decent gains, which is even more concerning. It means that not only we have all the clues via the combination of risky assets telling us that the risk conditions are on the decline rapidly but gold performance reinforces this notion as well.
Yield Curve: Outlook For Growth, Inflation & Policies
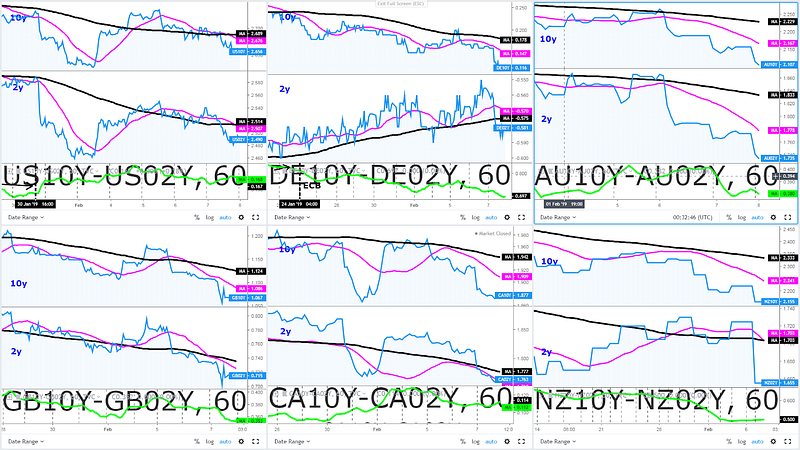
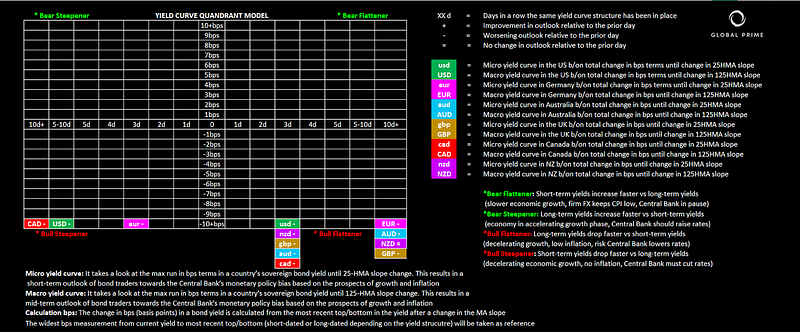
If one is after further evidence that the risk-off environment is well and alive, our prop yield curve quadrant model should leave little room for doubt. We are in a context predominantly dominated by a bull flattening phase, which translates in bonds yields across the globe depressed as the flight to safety accelerates. Bonds are starting to attract increasing flows as the deleveraging away from equities gathers momentum, especially in light of the uncertainty surround a US-China trade deal.
This quadrant tells us bond traders clearly signal the global growth story keeps deteriorating. The fact that long-dated bond yields are dropping at a faster rate than short-dated it’s telling us that it’s primarily a story of discounting the growth outlook vs inflation, which is also set to stay well under Central Banks’ mandated levels but within contained levels. The US and Canada, unlike the rest of the countries boxed in a bull flattening phase, exhibit bull steepener, which occurs when bond traders trade under the conviction that interest rate should be cut to calibrate the demand and supply of money. The behaviour in the market remains all tied to US-CH trade negos and hopes that a deal may see a potential reinvigoration into H2. Even the risk rally in Jan has occurred amid very depressed yields, mainly orchestrated by the promises that CBs (ECB, FED) will keep the liquidity hose open.
Wonder what’s the yield curve in a bond? It’s really critical to understand what the market is pricing in terms of Central Bank policies going forward. Learn the basics in this article.
Chart Insights: Technicals & Intermarket Analysis
EUR/USD: Bearish Momentum Increases Volatility
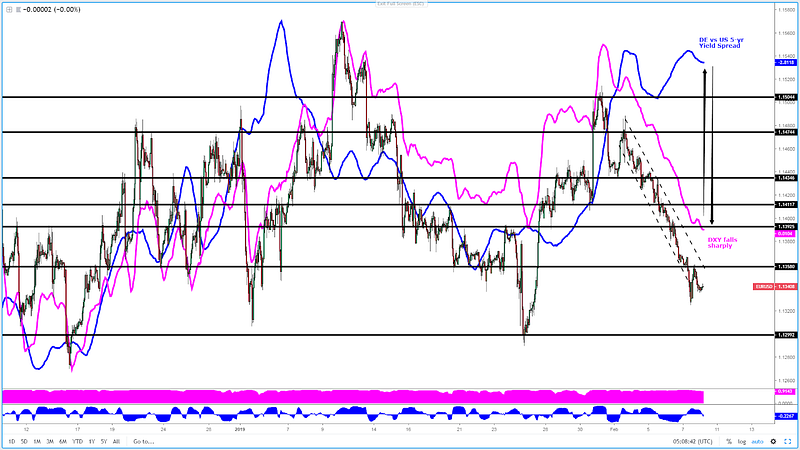
When a downtrend increases its vol, it tends to be a double-edged sword. On one hand, it allows an acceleration in profitability as the moves are more expansionary in nature. Prove of that is the breakout of the channel bottom-side during the last European morning. However, notice that the rebound has been equally vol and impulsive before liquidity dried up? Whenever we see this occurrence, it raises a red flag about a potential trend reversal conditioned to price action in agreement, which for now is not. The path of least resistance, judging the renewed strength in the DXY (magenta), from which the Euro/US Dollar pair accounts for 57% of the basket, it’s still too premature to anticipate a sudden change in trend, with 1.13 as the next clear target for sellers. The first indication that the market may technically start to show some cracks is by a retake of 1.1360 (horizontal resistance + descending channel trendline). The German vs US yield spread shows such a divergence from the actual price that is hard not to anticipate value in becoming a potential buyer once the sell-side campaign lands at 1.13 and level below. This is by far the widest divergence between the bond yield spread and the DXY/EURUSD we’ve seen for months.
GBP/USD: Strength In USD Poses May Keep Upside Limited
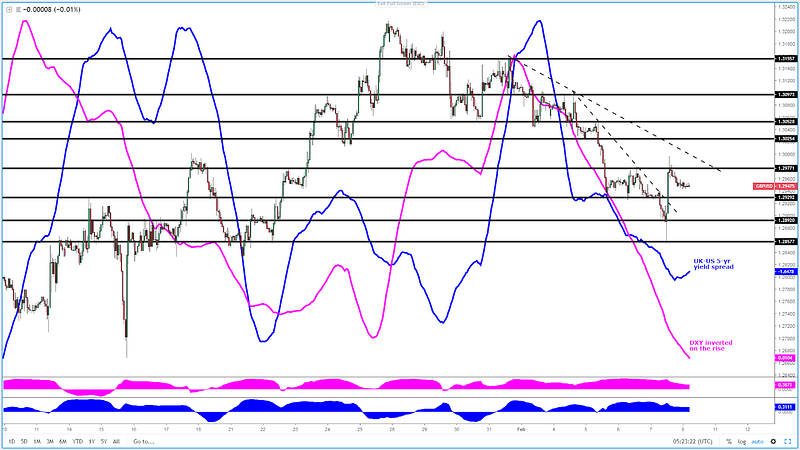
The spike post-BoE has broken above the most pronounced downward trendline, helping to alleviate the technical bear-side pressure, even if the appreciation in the GBP failed to find acceptance above the level of resistance at 1.2975–80. Those filled long on the breakout came to an unpleasant bull trap realization as the 1.30 psychological level snapped the price right back down as ample pockets of supply remain present (the hourly pin is a testament). Nonetheless, the breach of the most recent high allows for a slightly more constructive outlook, with buyers now expected to take control of 1.2930 horizontal support (potential inverted H&S) in order to keep making progress, with the real inflection point a recovery above the 1.30 round number. Should sellers find equilibrium sub the mentioned level, 1.29–1.2890 would be the next logical target for the sellers ahead of 1.2855–60 (yesterday’s low). Cross-referencing correlated asset classes (DXY, UK-US 5y bond yield spread) I still can’t envision how GBP gains enough fortitude, knowing how tightly correlated the pair has been to both instruments as of late. The unpredictable Brexit landscape is yet another concern weighing.
USD/JPY: Risk Off-Led Selling Capped By Rampant USD
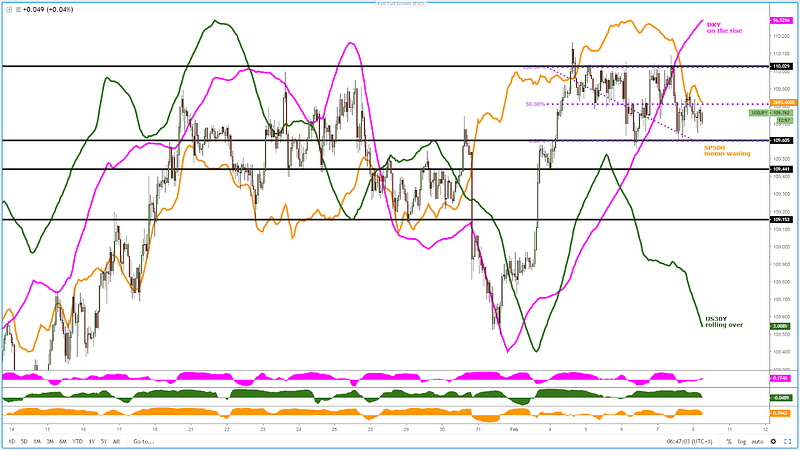
The fortitude of the US Dollar has kept the pair in a relatively tight range. If the same risk profile stays in place, it’s hard to envision how the pair can sustain at these hefty levels. It was only yesterday that I speculated on a scenario in which the rolling over of equities would have an immediate impact in exposing the downside as divergences were already in existence between price and US yields. Now that equities and US 30y yields are alienated with the same bearish dynamics, any hiccups in the DXY should be the last straw needed to break down the range. By running a correlation coefficient of the last 2 days (48-period in the hourly), we are starting to see how the pair is finally decoupling from the DXY as the US yields and the SP500 exert sync downward pressure, Amid such market structure, there is a lot of intraday noise unless engaged at the edges 110.00–109.50–60. One can also use as reference the midpoint of the range at 109.80 to gauge what side has been most recently in control.
AUD/USD: Perfect Bearish Storm
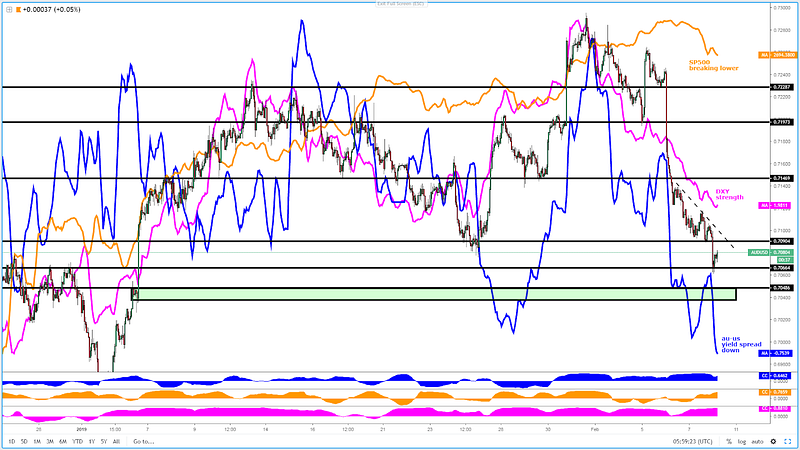
The Aussie is caught in a negate loop that is hard to ignore. By running a correlation coefficient we can understand that the market is currently driven by 2 main factors: 1- Aussie vs US bond yield differentials, which keep falling further as the market prices in an eventual RBA rate cut. 2- The ample demand for US Dollars even as the Fed mulls the possibility of an end to QT (no better alternatives). Technically, we can draw a descending trendline to help us to visually understand the type of order flow behind the market. For now, it does look quite regular and non-volatile, with impulsive sell-offs countered by corrective pullbacks. These are clear dynamics for a trend continuation, with the correlated instruments (DXY, Aus-US yield spread) alienated to see follow-through. The area marked in a green rectangle is where one may expect the next pocket of demand should 0.7065 give in.
GBP/AUD: Bullish Momentum Play
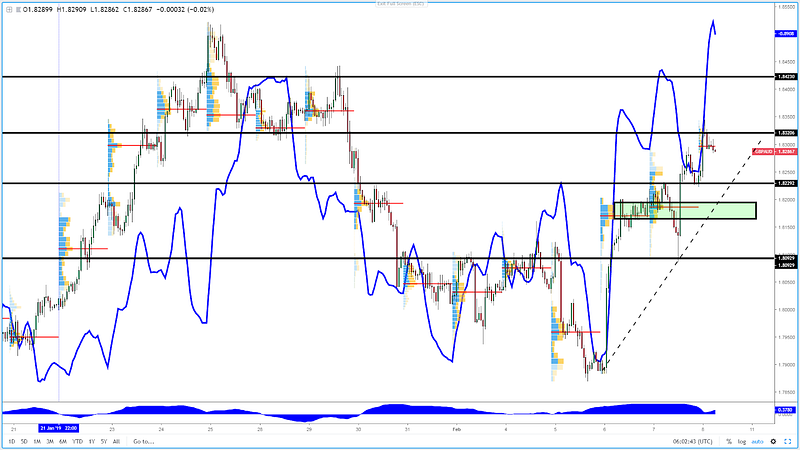
Barring any Brexit headline that distorts the current price action, the pair looks poised to be a rather interesting proposition to play the long side. As we can observe, in the last 48h, volume has been trapped to the downside, which further vindicates what side is most in pain (those caught short). In terms of valuations, the rampant move in the UK-AU bond yield spread legitimizes higher levels too. Besides, as the correlation coefficient demonstrates, this week is all about tracking Aussie yields, hence why looking to join the bid for an eventual target of 1.84 or beyond seems a sensible strategy.
Important Footnotes
- Risk model: The fact that financial markets have become so intertwined and dynamic makes it essential to stay constantly in tune with market conditions and adapt to new environments. This prop model will assist you to gauge the context that you are trading so that you can significantly reduce the downside risks. To understand the principles applied in the assessment of this model, refer to the tutorial How to Unpack Risk Sentiment Profiles
- Cycles: Markets evolve in cycles followed by a period of distribution and/or accumulation. The weekly cycles are highlighted in red, blue refers to the daily, while the black lines represent the hourly cycles. To understand the principles applied in the assessment of cycles, refer to the tutorial How To Read Market Structures In Forex
- POC: It refers to the point of control. It represents the areas of most interest by trading volume and should act as walls of bids/offers that may result in price reversals. The volume profile analysis tracks trading activity over a specified time period at specified price levels. The study reveals the constant evolution of the market auction process. If you wish to find out more about the importance of the POC, refer to the tutorial How to Read Volume Profile Structures
- Tick Volume: Price updates activity provides great insights into the actual buy or sell-side commitment to be engaged into a specific directional movement. Studies validate that price updates (tick volume) are highly correlated to actual traded volume, with the correlation being very high, when looking at hourly data. If you wish to find out more about the importance tick volume, refer to the tutorial on Why Is Tick Volume Important To Monitor?
- Horizontal Support/Resistance: Unlike levels of dynamic support or resistance or more subjective measurements such as fibonacci retracements, pivot points, trendlines, or other forms of reactive areas, the horizontal lines of support and resistance are universal concepts used by the majority of market participants. It, therefore, makes the areas the most widely followed and relevant to monitor. The Ultimate Guide To Identify Areas Of High Interest In Any Market
- Trendlines: Besides the horizontal lines, trendlines are helpful as a visual representation of the trend. The trendlines are drawn respecting a series of rules that determine the validation of a new cycle being created. Therefore, these trendline drawn in the chart hinge to a certain interpretation of market structures.
- Correlations: Each forex pair has a series of highly correlated assets to assess valuations. This type of study is called inter-market analysis and it involves scoping out anomalies in the ever-evolving global interconnectivity between equities, bonds, currencies, and commodities. If you would like to understand more about this concept, refer to the tutorial How Divergence In Correlated Assets Can Help You Add An Edge.
- Fundamentals: It’s important to highlight that the daily market outlook provided in this report is subject to the impact of the fundamental news. Any unexpected news may cause the price to behave erratically in the short term.
- Projection Targets: The usefulness of the 100% projection resides in the symmetry and harmonic relationships of market cycles. By drawing a 100% projection, you can anticipate the area in the chart where some type of pause and potential reversals in price is likely to occur, due to 1. The side in control of the cycle takes profits 2. Counter-trend positions are added by contrarian players 3. These are price points where limit orders are set by market-makers. You can find out more by reading the tutorial on The Magical 100% Fibonacci Projection
The Daily Edge is authored by Ivan Delgado, Head of Market Research at Global Prime. The purpose of this content is to provide an assessment of the market conditions. The report takes an in-depth ...
more

