
Trucking Industry Growth Likely Contracted In 2019
Headline data for the American Trucking Association (ATA) and the CASS Freight Index are providing opposing statistics - is trucking up or down?
Analyst Opinion of Truck Transport
The CASS index is inclusive of rail, truck, and air shipments. The ATA truck index is inclusive of only trucking industry member movements (ATA's tonnage data is dominated by contract freight). Even so, CASS breaks out trucking and claims it is down 3.3 % year-over-year and down 1.9 % month-over-month.
I tend to put a heavier weight on the CASS index which is consistent with rail and ocean freight. It is not logical that truck freight goes up when industrial production and ocean freight decline.
Econintersect tries to validate truck data across data sources. It appears this month that the truck employment rate of growth continues to slow. Please note using BLS employment data in real-time is risky, as their data is normally backward adjusted (sometimes significantly). Additionally, Econintersect believes that the BLS is not capturing all truck employment.

ATA Trucking
American Trucking Associations' advanced seasonally adjusted (SA) For-Hire Truck Tonnage Index increased 3.3% in all of 2019, about half the annual gain in 2018 (6.7%), for the tenth straight annual increase.
Said ATA Chief Economist Bob Costello:
Last year was not a terrible year for for-hire truck tonnage, and despite the increase at the end of the year, 2019 was very uneven for the industry. The overall annual gain masks the very choppy freight environment throughout the year, which made the market feel worse for many fleets. In December, strong housing starts helped advance the index forward.
ATA Truck tonnage this month

The advanced SA For-Hire Truck Tonnage Index rose 4% in December after falling 3.4% in November. In December, the index equaled 118.2 (2015=100) compared with 113.6 in November.
source: ATA
CASS FREIGHT INDEX REPORT
The following was reported by CASS:
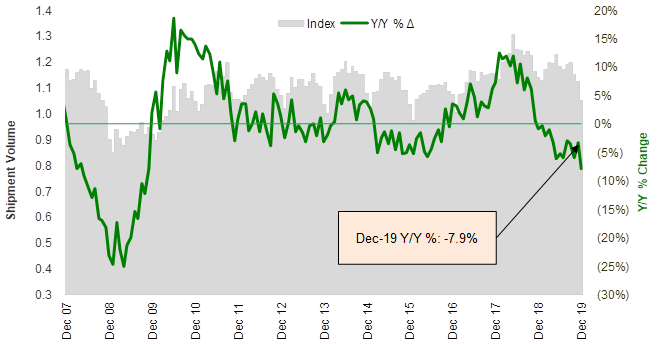
- North American freight volumes fell 7.9% year over year in December, marking the largest decline in 11 years and reaching their lowest point since January 2018
- With excess capacity, truckload linehaul rates remain down year over year (-3.3%)
- Intermodal shipping costs are up slightly at .7% year over year, against a tough comp because of last year's rush to beat the tariffs. Compared to December 2017, intermodal costs are up 9.1%.
It wasn't the prettiest month for the Cass Index, which means it wasn't the best month in the freight world. Both the shipments and expenditures components of the Cass Freight Index marked their lowest reading of 2019 and took another step backwards in terms of y/y growth. There is lots of hope in the stock market and the freight market for a better 2020, but the trends have yet to turn. Maybe with the January index readings? Doubtful, as the index (both shipments and expenditures) normally falls off sequentially from December to January, which would imply another negative y/y comp ahead. Our view is that the second quarter of 2020 has the best chance of seeing actual y/y growth in shipments and freight costs, if traditional seasonal freight patterns hold, as the second quarter of 2019 did not see the typical seasonal surge in activity.
Shipment volumes dropped 7.9% vs December 2018 levels, as the index posted its lowest reading since January 2018. It was also the steepest y/y decline since the Great Recession of 2008-2009. Although there were the same number of working days in December 2019 and December 2018, some industry participants we've spoken with about the sluggish end to the year cited Christmas and New Year's Day both falling on a Wednesday as the reason for soft volume and low productivity the last week or so.
"December songs no longer I sing."
| December 2019 | Year-over-year change | 2-year stacked change | Month-to-month change | |
| Cass Freight Index - Shipments | 1.052 | -7.9% | -8.6% | -6.4% |
| Cass Freight Index - Expenditures | 2.723 | -6.2% | 3.2% | -3.1% |
| Truckload Linehaul Index | 135.50 | -3.3% | 3.3% | -1.9% |
| Intermodal Price Index | 148.12 | .7% | 9.1% | .6% |
Disclaimer: No content is to be construed as investment advise and all content is provided for informational purposes only.The reader is solely responsible for determining whether any investment, ...
more

