
Trend, Trend Exhaustion And The Shifting Ground
There are times when keeping an eye on the markets is as exciting as watching paint dry. Then, there are times when great leaps literally happen faster than you can blink. You be the judge as to whether the former or the latter better applies to the euro and Australian dollar right now.
EUR/USD – Trend Emerging
(Click on image to enlarge)
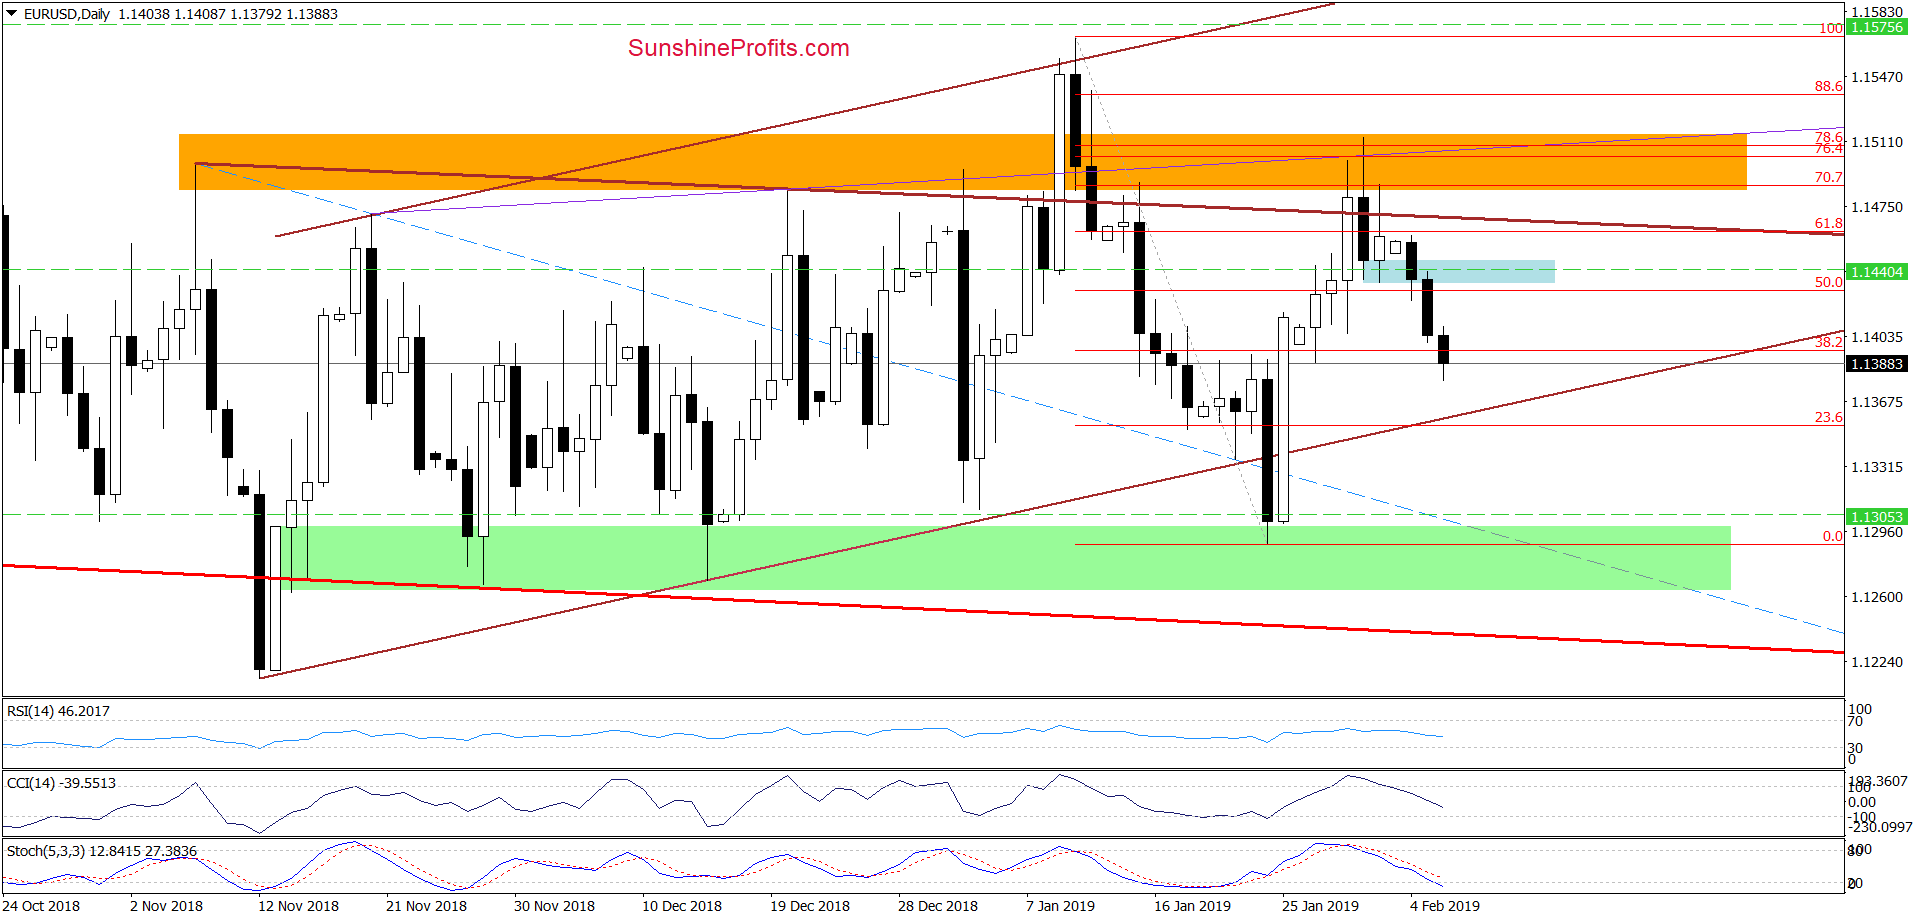
Yesterday, EUR/USD extended losses and closed the day below the blue support zone, making our short positions even more profitable (our subscribers were prepared in advance and we opened the shorts in close vicinity of the blue support zone on Monday). Today, the bearish momentum continues and at the moment of writing these words, the pair is trading at around 1.1385.
This increases the probability of the bearish scenario coming true. How low can the euro fall in the coming days? Retesting the lower border of the brown triangle would come first,likely to be followed by the green support zone that has stopped the sellers several times in recent weeks.
USD/CHF – Resistance vs. the Trend
(Click on image to enlarge)
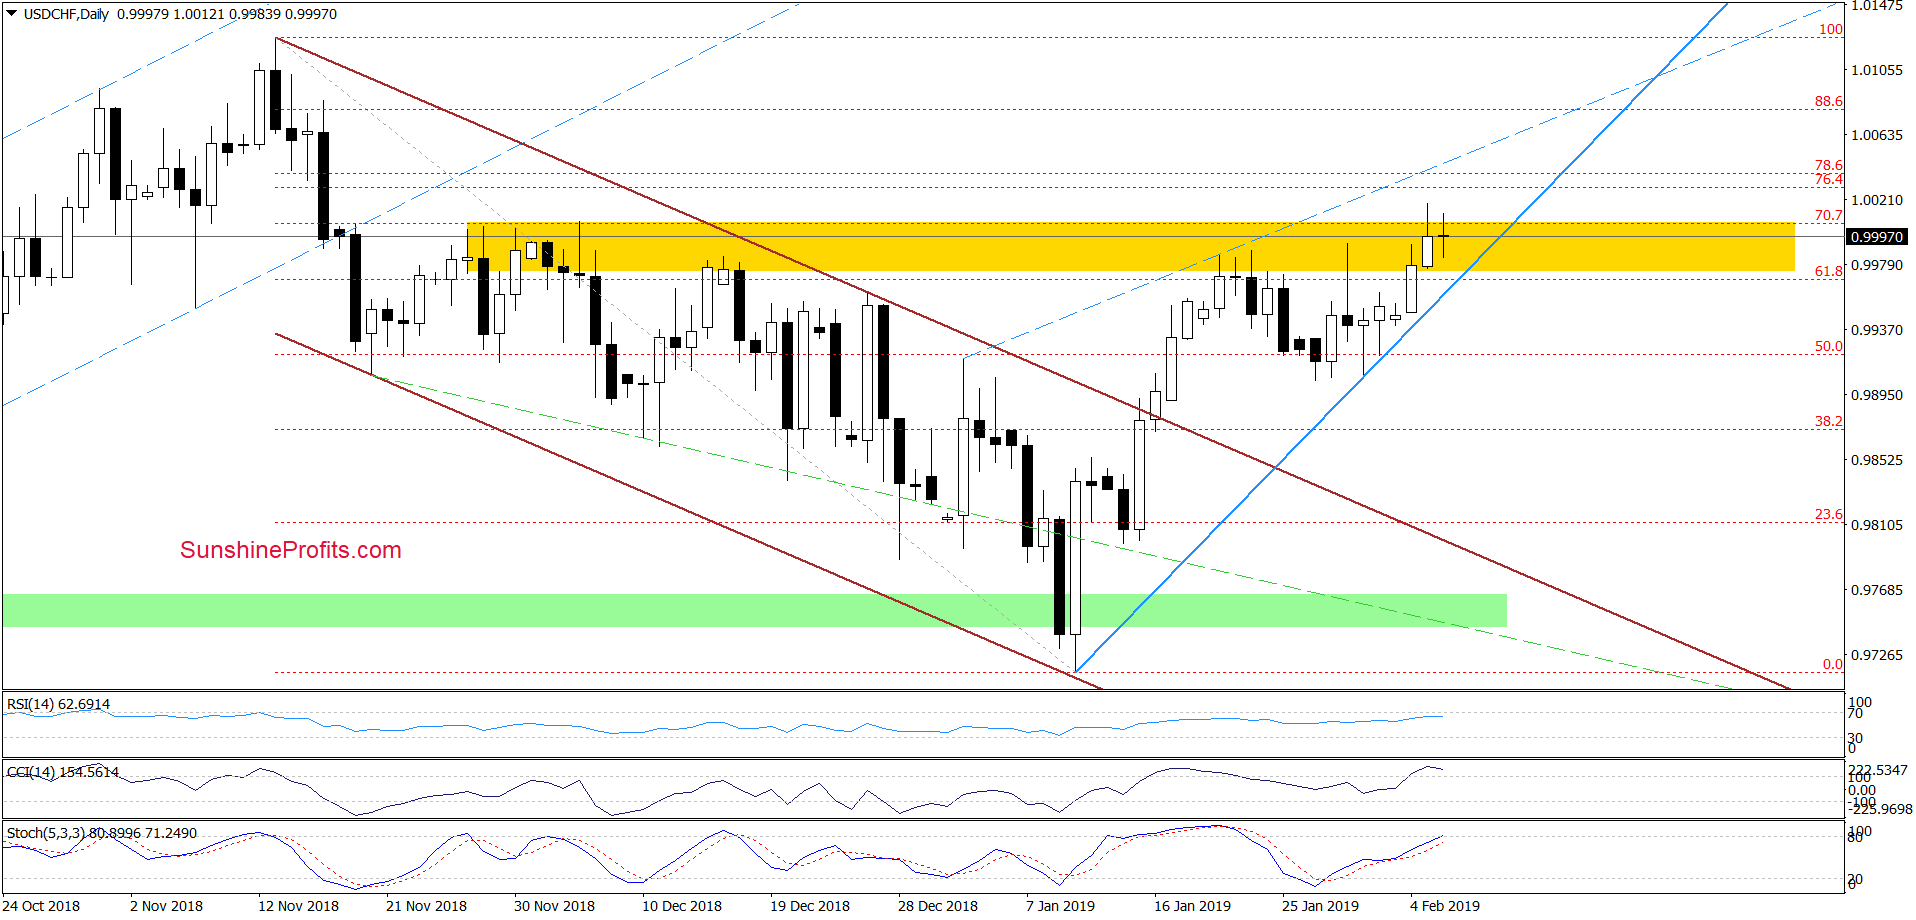
On Tuesday, currency bulls managed to take USD/CHF to a fresh 2019 peak, which produced a tiny breakout above the upper border of the yellow resistance zone. The bullish sentiment proved short-lived as evidenced by the long upper knot, and the pair closed inside the yellow resistance zone. This invalidation of the earlier tiny breakout doesn’t bode well for higher values of the exchange rate in the coming days.
However, as long as there are no sell signals generated by the daily indicators, one more attempt to move higher can’t be ruled out. It could test the 76.4% or 78.6% Fibonacci retracements and even reach the blue dashed line (that would be the upper border of the potential blue rising wedge).
AUD/USD – Like a Hot Knife through Butter
(Click on image to enlarge)
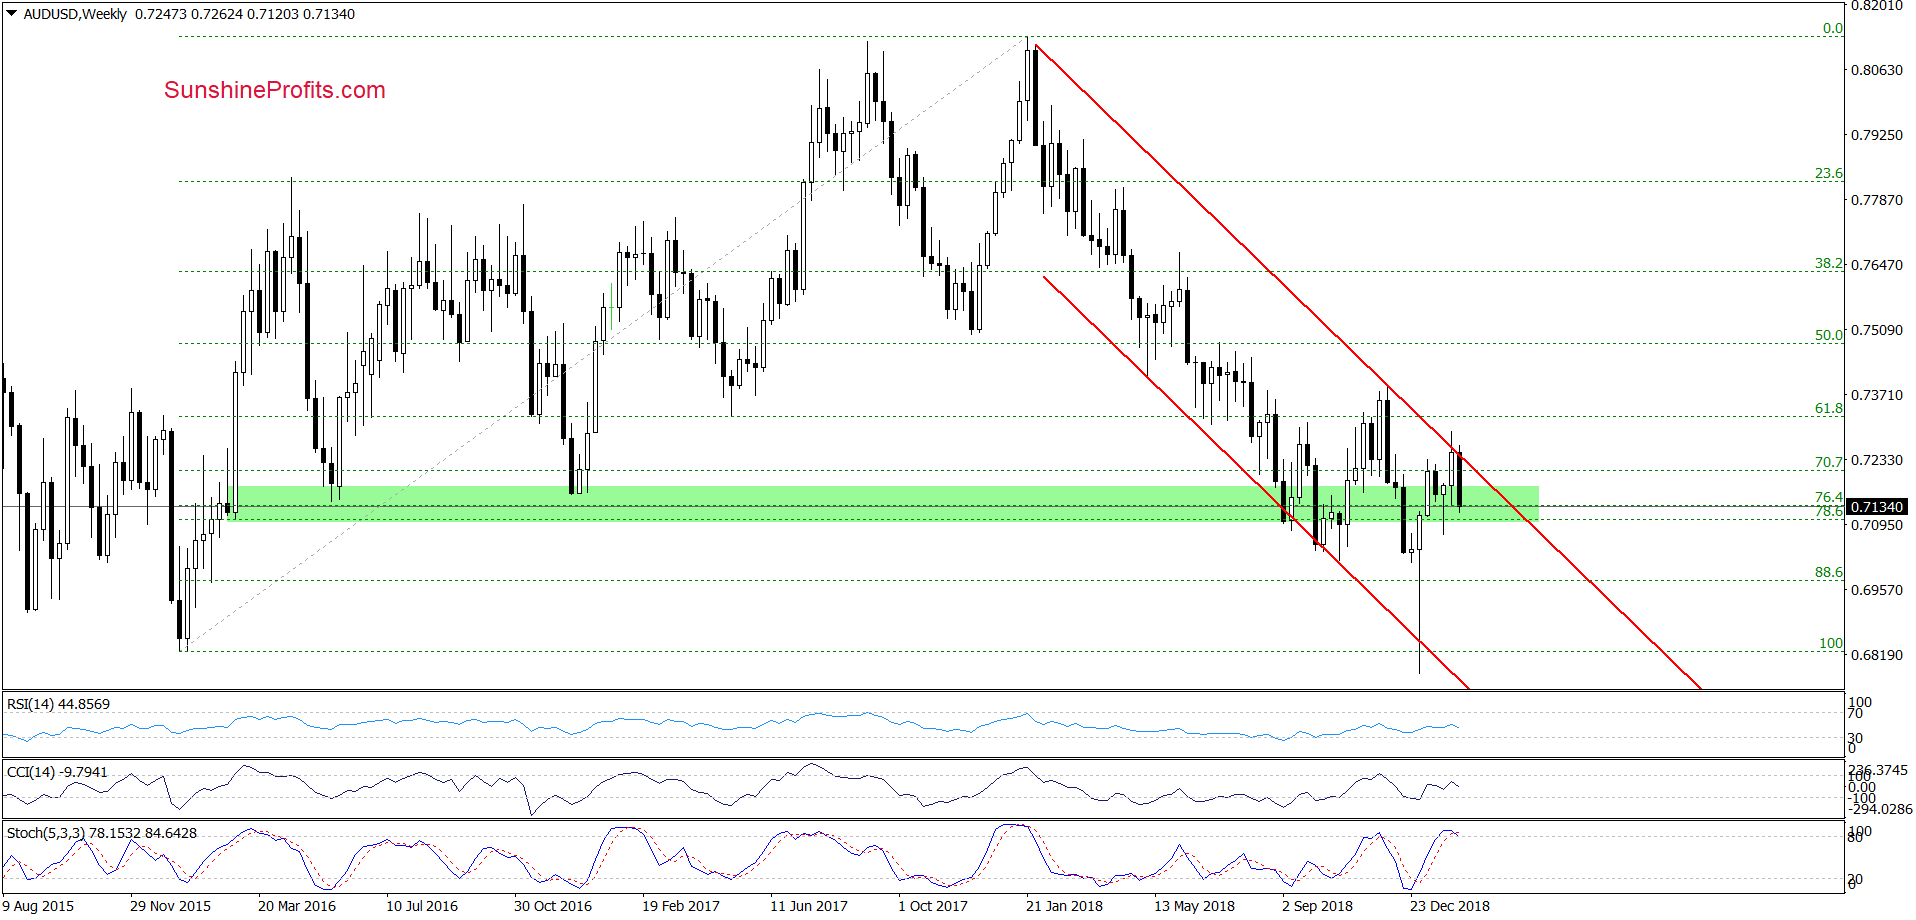
(Click on image to enlarge)
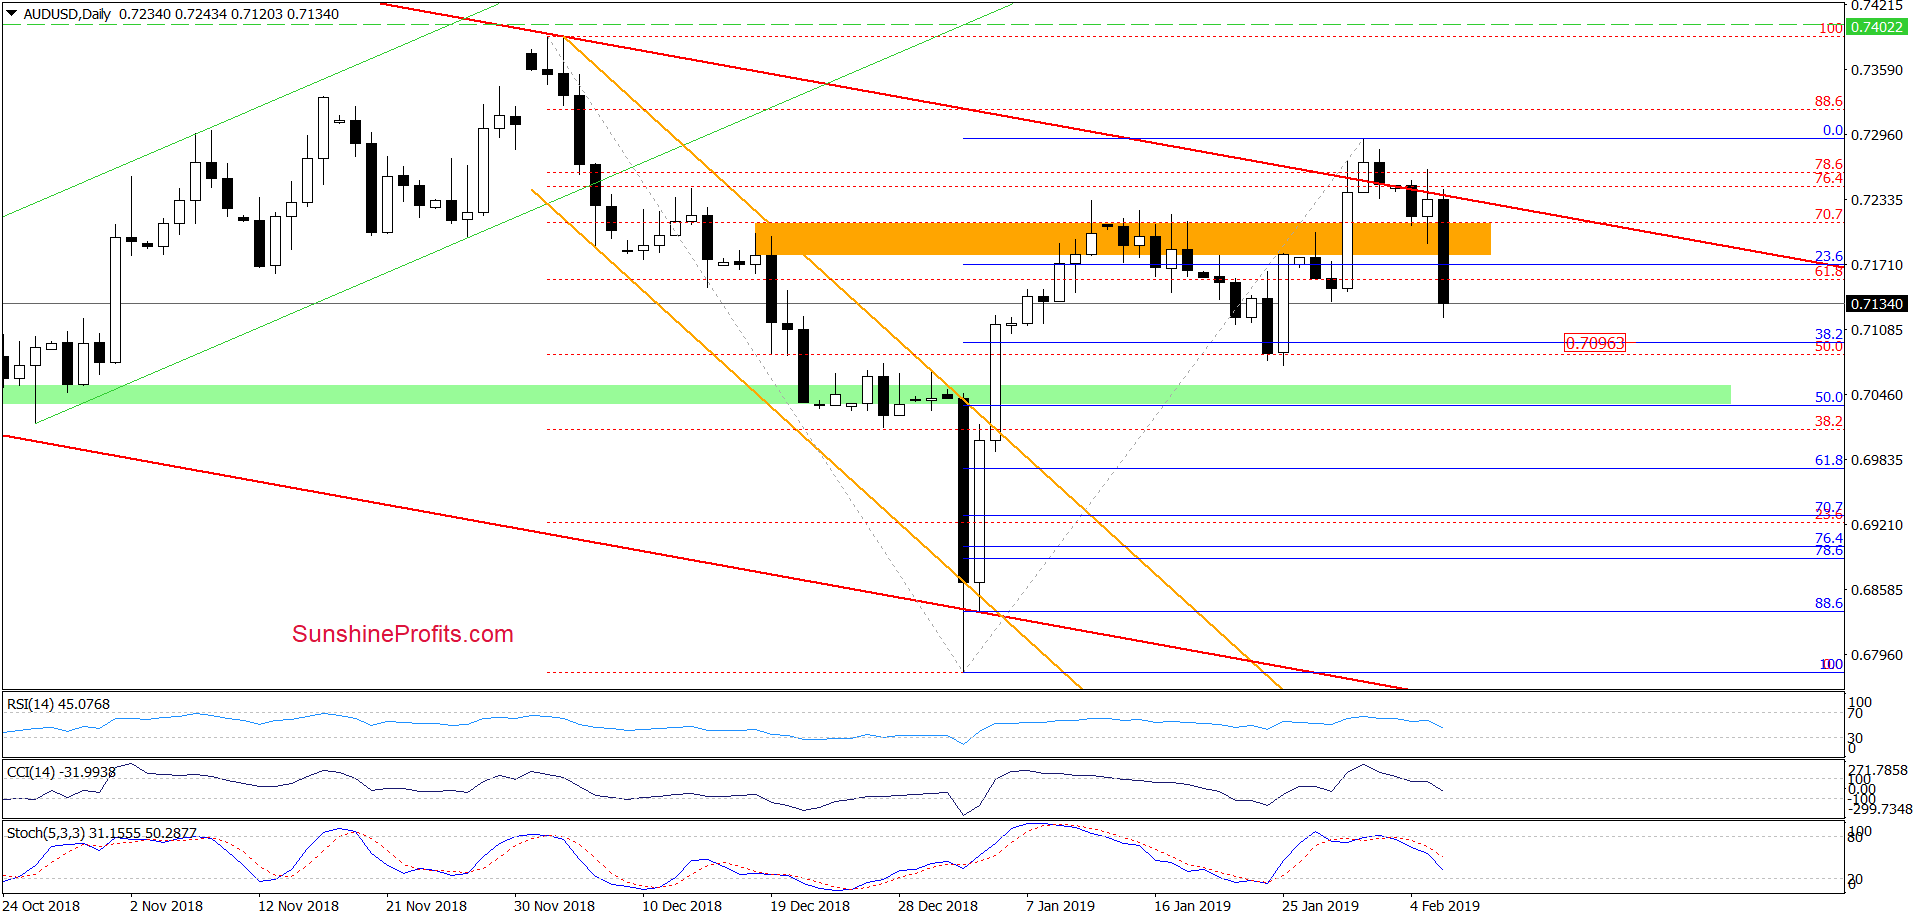
On Monday, we wrote:
(…) The proximity to the 38.2% Fibonacci retracement encouraged the sellers to act and the pair slipped back below the upper line of the red channel and also below the January peak. This invalidation of the trend channel breakout serves as a strong bearish sign in itself, and in combination with the sell signals generated by the indicators increases the probability of further declines.
We see that the situation developed in tune with our assumptions. AUD/USD moved sharply lower, making our short positions even more profitable (our subscribers were prepared in advance and we opened the shorts in close vicinity of the upper border of the declining red trend channel on Monday).
Thanks to today’s downswing, the pair not only verified the earlier breakdown below the upper border of the declining red trend channel but also cut through the orange zone like a hot knife through butter. The orange zone used to be a resistance and with the breakout last week, it looked like it would become a support now. However, the support didn’t hold and thus the zone has back again turned into a resistance. This is what invalidation of a breakout looks like – a strongly bearish sign on its own.
On top of that, the sell signals generated by the daily indicators remain on the cards. They suggest further deterioration and a realization of our Monday’s scenario in the very near future, namely that we’d likely see a test of the recent lows.


