
Treasury Spreads And Measured Policy Uncertainty
Treasury spreads ... Do they matter?
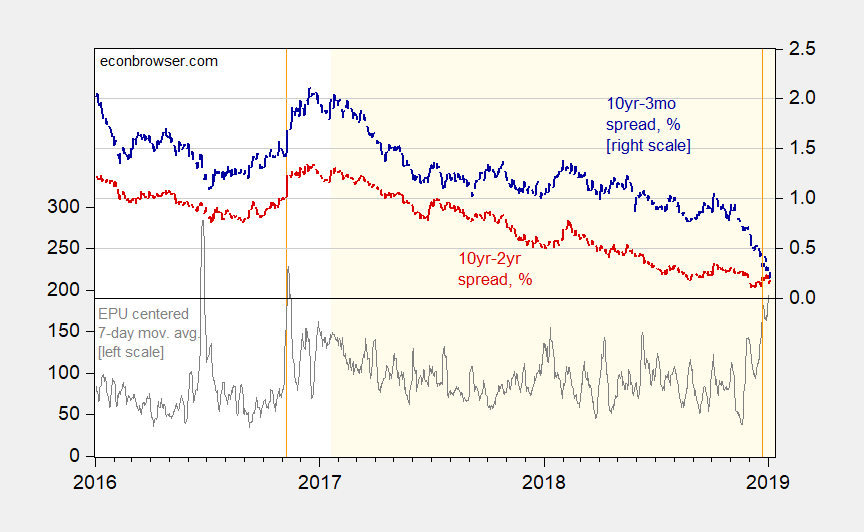
Figure 1: Economic Policy Uncertainty, 7 day centered moving average (gray, left scale), 10 year-3 month Treasury spread (blue, right scale), 10 year-2 year spread (red, right scale), both in %. Orange denotes Trump administration. First orange line at election; second at government closure. Source: policyuncertainty.com, FRED, and author’s calculations.
Why should we care? The spreads is of interest for well-known reasons. Interestingly, the economic policy uncertainty index (Baker-Bloom-Davis) seems to presage recessions at six month lags (statistically so, in-sample). I show this in the below graph, where both indicators are lagged 6 months.
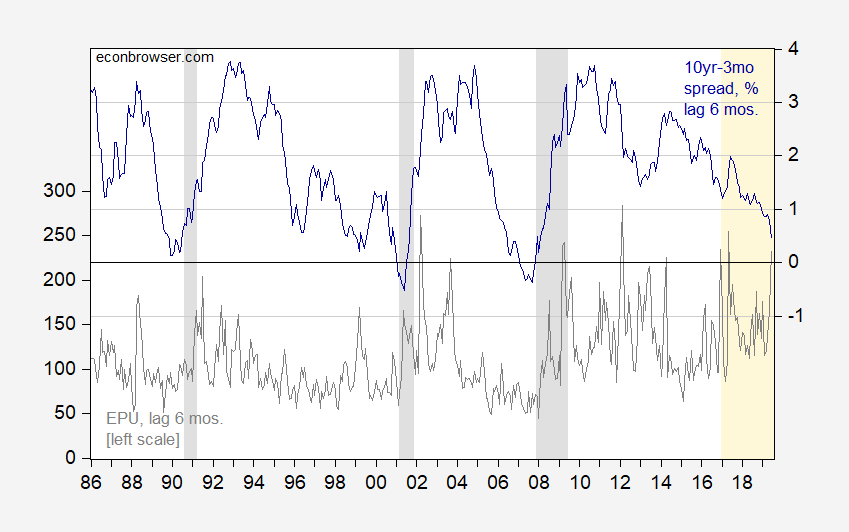
Figure 2: Economic Policy Uncertainty (gray, left scale) lagged 6 months, and 10 year-3 month Treasury spread (blue, right scale), in %, lagged 6 months. NBER defined recession dates shaded gray. Orange denotes Trump administration. Source: policyuncertainty.com, FRED, and author’s calculations.
While lagged economic policy uncertainty is statistically significant in-sample, it’s not clear it would be helpful out-of-sample (note that in the 1990-91 recession, elevated uncertainty shows up as a correlate at a less than 6 month lag). Analysis is hampered by the small sample (3 recessions for the period spanned by the Baker-Bloom-Davis index).
Food for thought. Maybe Trump’s policies will give us an increase in the sample size.
Disclosure: None.


