
Trade War: Escalation Phase
The dramatic turn in the trade negotiations that has taken place since the stock market closed on Friday, May 3 is captured in the segment below from The Wall Street Journal:
“The U.S. and Chinese governments both sent signals ahead of their trade talks in Washington last week that a pact was so near they would discuss the logistics of a signing ceremony. In a matter of days, the dynamic shifted so markedly that the Chinese deliberated whether to even show up after President Trump ordered a last-minute increase in tariffs on Chinese imports because the U.S. viewed China as reneging on previous commitments.”
The markets are adjusting to the shift from a cooperative phase in the trade war to an escalation phase. The drop in the U.S. stock market futures on the morning of May 13 after China announced another set of tariffs on U.S. goods sends a clear message the financial markets are concerned about the economic damage that could come from an ongoing and combative trade war. The million-dollar question is how long will the current escalation phase last? Markets will have higher odds of stabilizing if the U.S. and China can show some signs of possibly making their way back to the negotiation table.
BIGGER PICTURE
There has been a slight shift in the data associated with the market’s long-term trend, but nothing earth-shattering at this point. Today’s relatively small adjustment to our asset mix got us back in line with the data and respects the uncertainty related to the duration of the current decline.
The market’s waning momentum in recent weeks told us to be open to a normal 4-10% pullback in the S&P 500. As of Monday’s close, the S&P 500 has experienced a drawdown of 4.55% based on closing prices and 5.17% using the recent intraday high and intraday low.
FIRST 90% DOWN DAY
Monday brought the first day in 2019 that featured extremely lopsided volume figures. Over 90% of NYSE volume was associated with declining issues.
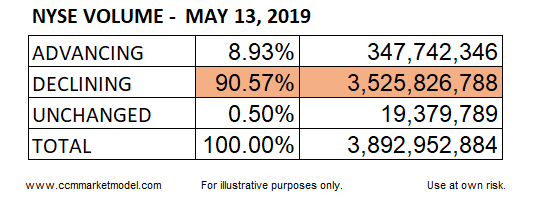
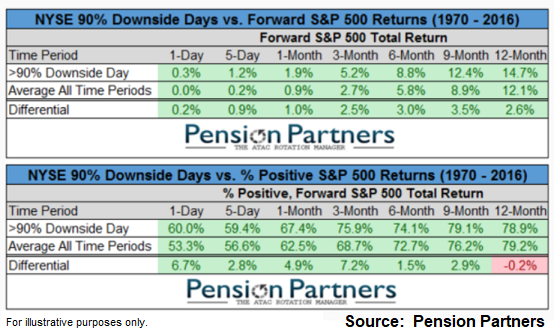
We know a 5% correction falls into the normal and to be expected category. How concerning is a 90% down day? As shown in the table below from Pension Partners, forward returns and percent positive figures for the S&P 500 are slightly better following a 90% down day relative to an average day.
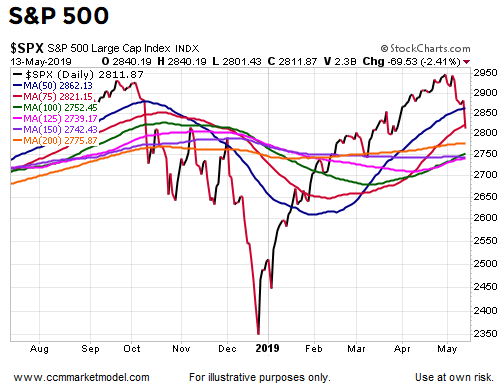
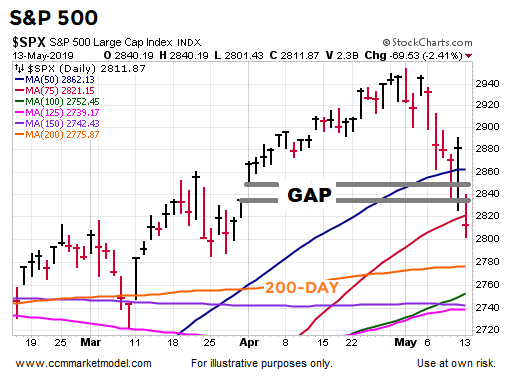
The chart below provides a good visual proxy for them, thus far, a relatively small shift in the data related to the market’s longer-term trend. The S&P 500 closed below the 50-day and below the gap. Price still remains above a still upward-sloping 200-day.
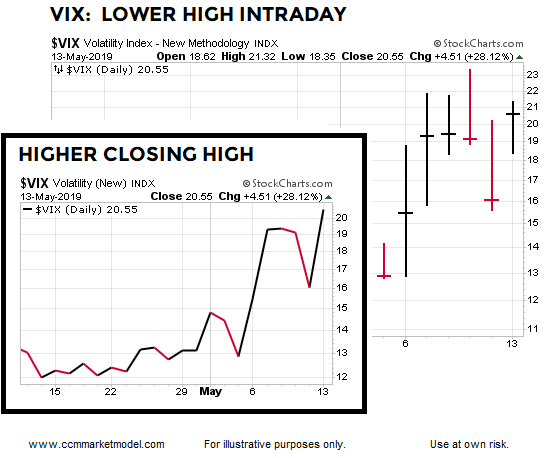
The VIX was a mixed bag during Monday’s session. It printed a daily closing high above last week’s high, but the intraday spike was lower than last week’s spike. Since closing prices tend to be more relevant, it is probably fair to say the VIX closed Monday in “still concerned” mode.
As noted in this video clip, even under a favorable longer-term outcome scenario, the market may continue to be volatile over the next 90 days. It is possible we will sit tight for the remainder of the week; it is possible the data will call for additional incremental steps to reduce exposure to risk assets. We will continue to take it day by day with an open mind about all outcomes.
Disclaimer: The opinions in this document are for informational and educational purposes only and should not be construed as a recommendation to buy or sell the stocks mentioned or to solicit ...
more

