
Trade Truce, Check! S&P 3,000... We'll See, And Why?
A quick review from some of my notes in the prior weekly Research Report before we get started, if you please…
“The most near-term risk to the market rally is the G-20 Summit meeting between President Trump and President Xi. To reiterate, Finom Group believes the base case scenario is a trade truce that includes:
- Agreement that no additional tariffs will be levied by either country
- Timeline is set in place to remove certain restrictions placed on Huawei’s business operations with regards to U.S. suppliers and buyers.
- Additional timeline for monitoring improvements made by China with regards to intellectual property theft
- Agreement to increase commodity purchases from the U.S. by China
“The markets have had a great run through June and now they have become mostly overbought, skewing risk to the downside near-term. Hedging activity remains elevated going into a critically important geopolitical event. We anticipate seeing a sideways to slightly lower market outcome for the week. Get your shopping list ready should the market defy the analysis and outlook.”
Much of what I outlined for the trading week, in terms of expectations, came to fruition with the major averages losing ground on the week and a trade truce between the U.S. and China enacted. It’s difficult to realize the major averages were all lower for the week given the uptrend that persisted from Thursday through week’s end. This is especially true when we reflect on the Market On Close order Friday that was one of the largest I’ve seen in 20 years.
All Things S&P 500
Nonetheless, indeed all 3 major averages finished slightly in the red for the week, with the Dow Jones Industrial Average lagging, down .45% for the week. The Nasdaq (NDQ) was down .32% and the S&P 500 (SPX) was the outperformer, down just .29% for the week.
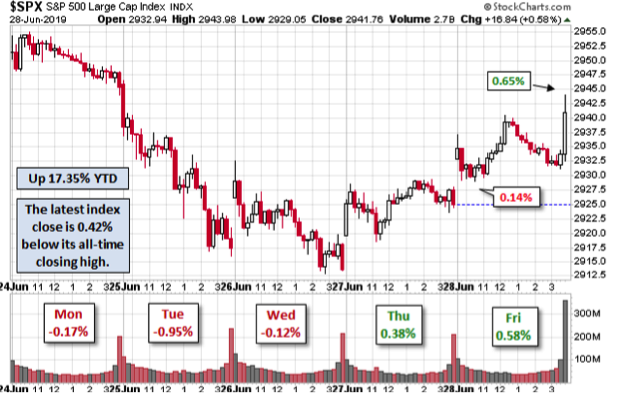
The month of June was quite spectacular, as the S&P 500 captured its greatest month of June since 1955. For the month, the S&P 500 jumped 6.9% and up more than 17% this year, marking its biggest first-half gain since 1997. If there is one thing the stock market is historically and profoundly adept at doing it’s “climbing a wall of worry”. And there has been a great deal to find concern about in 2019.
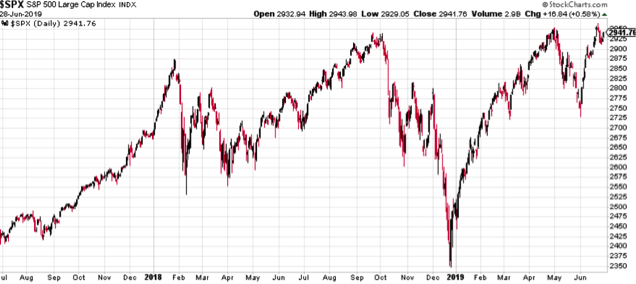
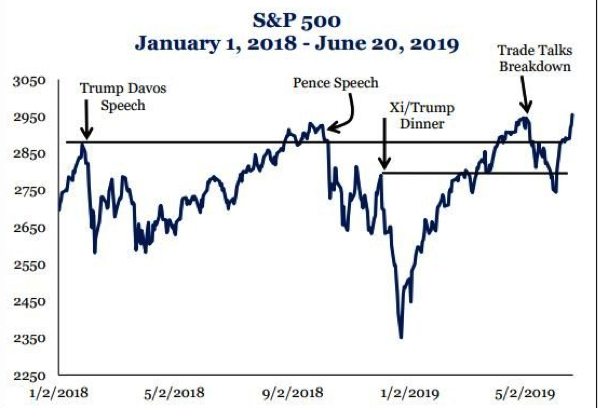
From trade feuds to subdued earnings and weakening economic data, the S&P 500 has found itself in an uptrend since the December 2018 bottom. A sudden May 2019 seven percent correction took just 2 weeks for the S&P 500 to recapture all that it had lost.
Speaking of the Q4 2018 market correction, which equaled 20% or a technical bear market, many investors may have overlooked this point of fact and may still not realize that it paved the way for a NEW bull market. The media doesn’t discuss the current bull market as being just 6 months in duration given the rapidity for which it has risen from the bear market territory expressed in Q4 2018. Nope! In fact, the only way investors will likely be privy to the understanding that this is indeed a new bull market, based on textbook definitions of bear markets, is if the bull dies rather quickly. Then the media will finally discuss the shortest bull market in history. But until then and remembering the former bear market in 2018…
“Investors had very low conviction at the start of this year, but those who were brave enough to once again get into risk assets reaped rewards,” said Wouter Sturkenboom, chief investment strategist for EMEA & APAC at Northern Trust Asset Management. “It’s a good lesson for investors not to stay scared for too long.”
With the S&P 500 up more than 17% in 2019, what most investors desire to know is how this typically plays out for the rest of the year and over the next 12 months. The good news is; it tends to add to its gains. The following table from Bullmarkets.co outlines that historically, when the S&P 500 is up more than 15% over a 6-month period, it continues to add more gains from a week later to 12 months later.
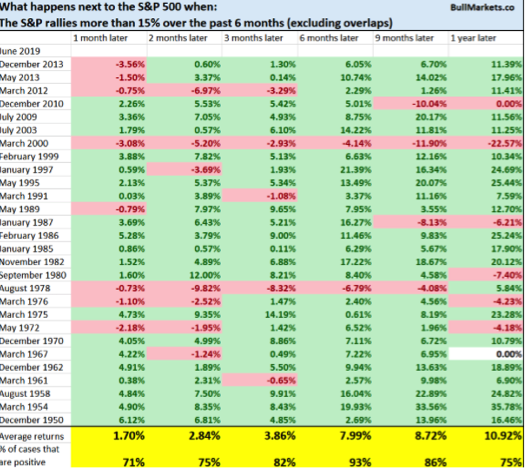
I should also note that the last 3 times the market was up more than 15% over the first 6 months of the year, the back half of the year did really well. What is probably most vexing about this year’s market rally is not only has it come with strong equity outflows and climbing a tall wall of worry surrounding the weakening economic conditions, but it’s the first year since 1995 that the S&P 500 and long-term U.S. Treasuries were both up 10%+ in the first half. (Bespoke Investment Group Table below)
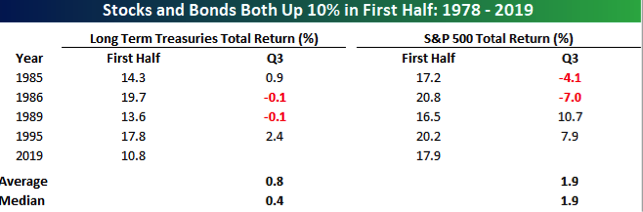
While the relationship between the performance of equities and U.S. Treasuries has changed over time, positive equity performance has coincided with weaker performance in treasuries and vice versa, but not always as is being evidenced once again 2019. This year is more predominantly about the Federal Reserve. Investors have been buying into both stocks and bonds in bets the Federal Reserve will reverse on monetary policy, bringing rates down to boost the economy. By all accounts, investors are largely winning on both fronts as the Fed has signaled the greater probability of cutting rates should their inflation mandate continue to fail achieving its stated target range of 2% inflation.
“Bonds have risen all year “despite a stock market which continues to trend higher. The stock market appears optimistic about the future of this recovery, whereas the bond market is acting increasingly nervous,” said Jim Paulsen, chief investment strategist at The Leuthold Group, in a note. Determining which market is right “is a tough call, but for equity investors we continue to lean toward the view that what doesn’t kill you will likely make ‘the stock market’ stronger.”
According to Paulsen, the combination of fear, room in valuations and accommodative central bank policies are setting up the market for even more upside in the year’s second half.
”[There’s] a lot of support for this economy and this market — and a lot of fear and caution. That’s a powerful combination, I think, for higher levels here down the road,”
I would tend to agree with Paulsen, fear and worry combined with strong technicals and now a trade truce could induce a market melt-up through year-end. It may not happen in a straight line, but the probability increases for each and every headwind removed from the economy and market.
As far as the technicals are concerned, the algos have likely been triggered. Why do I suggest this? Trend-following strategies are tied to technicals and one of the most popular trend-following strategies is as follows:
- Buy when the S&P 500 is above its 200-DMA.
- Buy when the S&P’s 50-DMA is above its 200-DMA (golden cross).
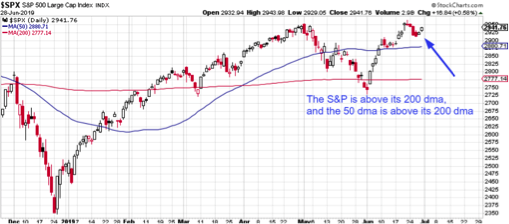
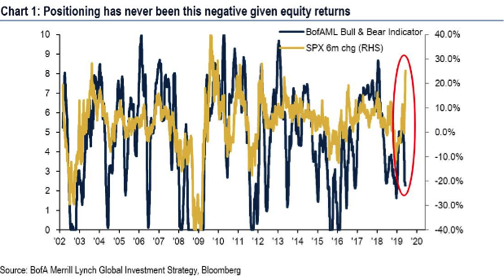
With both criteria satisfied presently, the algos have been engaged and will likely add support to the market on dips. Even when considering this important fact of the current market trend, investors have remained very, very uneasy about the market trend in 2019. Bank of America Merrill Lynch analysts led by Michael Hartnett, chief investment strategist, says that investors have never been so negative on a market that is rallying so persistently.
As mentioned in previous reports, the negative sentiment underlying the stock market rally and cash on the sidelines has the potential to reverse and invoke a market melt-up. All it needs is the right catalyst. With the weekend headlines on trade, this may prove the catalyst the market has been awaiting. But still yet, there remain other considerations.
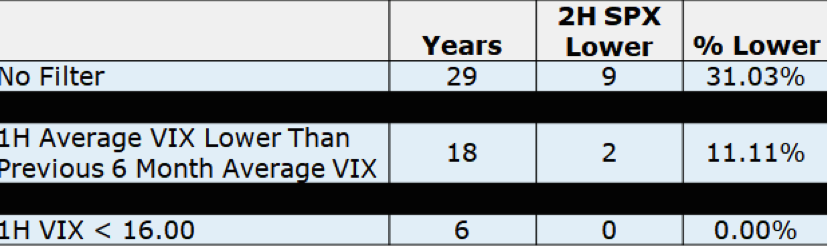
An interesting note on the VIX and S&P 500 for the year comes from our friend Russell Rhoads, formerly of the CBOE. "First Half 2019 VIX Average will be around 15.82 at the end of today Q2 2019. This is lower than the 2H 2018 Average of 16.96. Since 1990 the SPX has never had a down 2H when the 1H VIX Average is lower than the previous 6 months and below 16. Average SPX, +8.6% for those 6 observations."
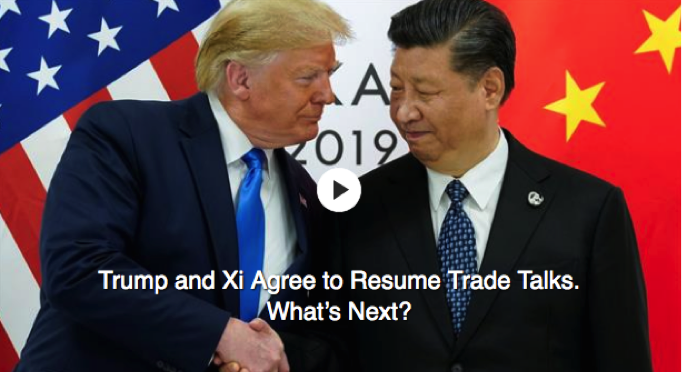
Trade Truce Comes To Light
For the time being, investors can breath a sigh of relief as the U.S. and China have agreed to not evoke and employ additional tariffs. The "worst case" trade war scenario was avoided in Osaka on Saturday when Trump agreed to restart trade talks with Xi, holding off new tariffs on Chinese exports, and signaling a pause in the trade hostilities between the world’s two largest economies; Trump added that while existing tariffs would remain in place the US president eased restrictions on Huawei as part of what is now the second ceasefire between the two superpowers in two months, removing an immediate threat looming over the global economy even as a lasting peace remains elusive.
"We had a very good meeting with President Xi of China, excellent, I would say excellent, as good as it was going to be," he said. "We discussed a lot of things and we're right back on track and we'll see what happens", Trump told reporters.”
Trump also said Saturday he would allow U.S. companies to sell their products to Huawei, but he was not yet willing to remove the company from a trade blacklist. The overall outcome from the G-20 Summit meeting between the two Presidents was largely what Finom Group has anticipated and as such we look forward to the next flare up, as we assume something will arise on the trade front, if not with China then quite possibly another nation. With this in mind, here is what Goldman Sachs offered in a note to clients Friday night:
- “By all accounts, the outcome of the Trump-Xi meeting at the G20 will likely bring about a commitment from both sides to engage further on the range of disagreements plaguing the trade and bilateral relationship. But we do not believe that this hiatus will remove all the trade-related uncertainty. Indeed, our economists continue to think that the Trump administration is not done with raising tariffs and the President’s stated desire for easier monetary policy might even motivate the White House to increase uncertainty again later in the year. Bottom line, with markets having already priced the increased prospects of a détente, we think risks are skewed towards a more tepid outcome. And we would continue to use sharp moves lower in $/Asia to rebuild hedges.”
The main problem with the way most analysts and the media represent the trade feud is that they don’t take into account a couple of very critical factors regarding how we got here. The first is that President Trump has wanted to take aim at china since the 1980s. Now he has that opportunity as President of the United States. Secondly, the Tax Reform was partly an attempt to quietly take some of the steam out of the engine of China, by lowering the tax rate on U.S. corporations and allowing them to harvest additional profits so they can open up manufacturing operations in the United States or at worst, south of the border in Mexico. This never happened. Instead, U.S. companies just bought back more stock and boosted their dividends. So what’s a President to do, since he’s been harboring an itch for some 30+ years?
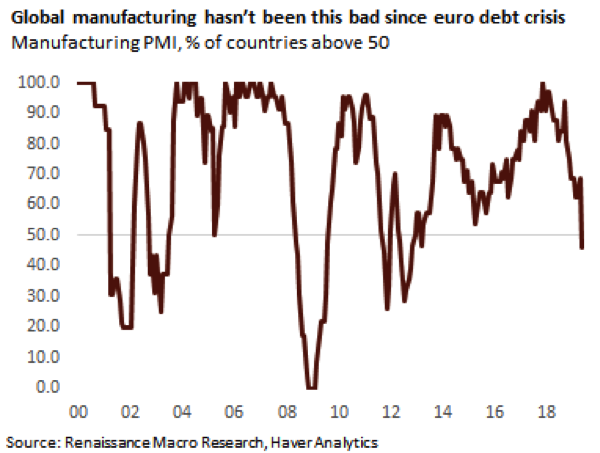
Since the President and White House Administration has gone directly after China and levied greater than $200bn in tariffs at a rate of 25%, the global economy has sputtered and with global PMIs falling into contraction territory. (Renaissance Macro)
With this in mind and with the latest cease-fire proving not to remove existing tariffs on China, the analyst community has to recognize the tariffs on China are akin to a place cardholder. The longer they remain in place, the more time U.S. companies have to consider and reconfigure their manufacturing and supply lines from China to elsewhere. This is really the only leverage the White House Administration has when it comes to reinforcing its determination of domestic growth and equitable trade around the world.
Finom Group (for whom I am employed) is of the opinion that existing tariffs will remain in place unless and/or until a greater number of U.S. companies reconfigure manufacturing and supply lines away from China. What about intellectual property rights? While we understand this to be a talking point within the trade feud, the reality is IP theft happens all over the world, including in the United States. If that weren’t the case, we wouldn’t need so many patent lawyers. To the extent laws are in place, they are in place given the frequency of IP theft and the inability to regulate against such an issue. Moreover, knowing the abundance of IP theft that takes place in China, do you know what also takes place in China: the growing desire to manufacture goods in China. U.S. corporations know the risk and accept it anyway. China will put on a good dog and pony show around IP regulations/laws, but to the extent this will alleviate the problem; we would remain skeptical.
With all that being offered around the cease-fire, here are what several analysts and money managers have to say about what investors might expect from the market and Fed going forward:
Mansoor Mohi-uddin, senior macro strategist at NatWest Markets in Singapore:
- “Investor sentiment is set to be buoyed in the week ahead by a truce in the U.S.-China trade war.”
- “Financial markets are unlikely to significantly reduce their expectations for Federal Reserve rate cuts despite global trade tensions easing. Thus risk assets -- stocks, commodities and emerging markets -- are set to rally while the safe-haven dollar, yen and Swiss franc underperform.”
Stephen Innes, managing partner at Vanguard Markets in Bangkok:
- The “reset button” being hit on trade talks was the markets’ base-case scenario, and this is supportive for risk, but the lack of a timeline for progress may cap “bullish topside ambitions.”
- “With no news reading algorithms to steamroll the markets on Saturday, traders will have a 36-hour cooling off period to quantify their next move. And I would expect the markets to be very orderly on Monday open.”
- The extensive lists of demands from both sides may be “a bridge too far.”
- “Underlying sentiment remains quite bearish in terms of the medium-term outlook for a U.S.-China trade deal as well the global growth outlook.”
Chris Weston, head of research at Pepperstone Financial in Melbourne:
- “I can’t see this meeting doing risk assets any harm, but there is still a lot of work to do to convince central banks they don’t need to act to keep the economic expansion in check.”
- “A few weak shorts may look to close out on Monday” given the tariff reprieve, prospects for negotiations to restart and that both sides “actually appear more united than expected.”
- Watch Sunday’s China PMI data.
Alfonso Esparza, senior market analyst at Oanda in Toronto:
- “Everybody played their part without any additional drama and until more details emerge we are back at square one.”
- “Oil is positioned to rise after the positive trade news.”
- “Gold will be pressured as trade optimism reduces the appeal of the yellow metal as a safe haven.”
Jean-Charles Sambor, deputy of head of emerging-market fixed income at BNP Paribas Asset Management in London:
- “This is of course good. Investors have been generally negative on both the probability of a meeting and the probability of a positive outcome following this meeting.”
- “High-yield spreads should do well. China high yield remains very cheap especially, and emerging-market currencies should continue to rally on the news.”
Banny Lam, head of research at CEB International Investment in Hong Kong:
- The outcome is “exactly” what the market had expected so the impact will be neutral.
- “I would say the G-20 summit delayed the escalation in trade tension, rather than solved the problem.”
- The U.S. and China will probably want to reach a deal soon amid pressures on their economies, but it will be “very difficult.”
Source: Bloomberg
Economic Data Highlights
After hovering at decade highs since April, the latest New Home sales data proved quite disappointing to investors and economists this past week.
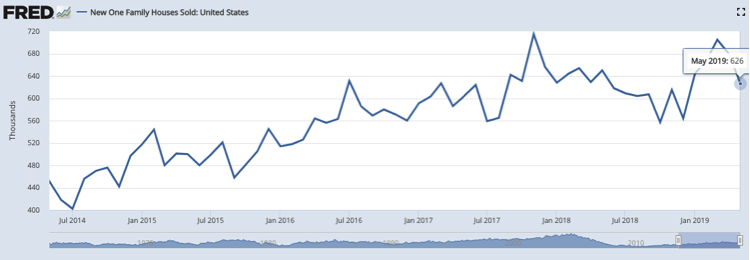
New-home sales ran at a 626,000 seasonally adjusted annual rate in May, the Commerce Department said Tuesday. The MarketWatch consensus forecast was for a 669,000 pace. What we encourage investors to take note of, in spite of the May disappointing print, is that the level of New Home sales remains at multi-year highs.
Sales fell 7.8% compared to April, but that month’s number was revised up. May sales were 3.7% lower than a year ago. At the current pace of sales, it would take 6.4 months to exhaust available supply, slightly more than the 6 months that’s normally considered a market evenly balanced between supply and demand.
In addition to a less than desirable reading on New Home sales, Consumer Confidence took a spill in the month of May. The Consumer Confidence index slipped to 121.5 from a revised 131.1 in May, the privately run Conference Board said Tuesday. It was the weakest result since September 2017.
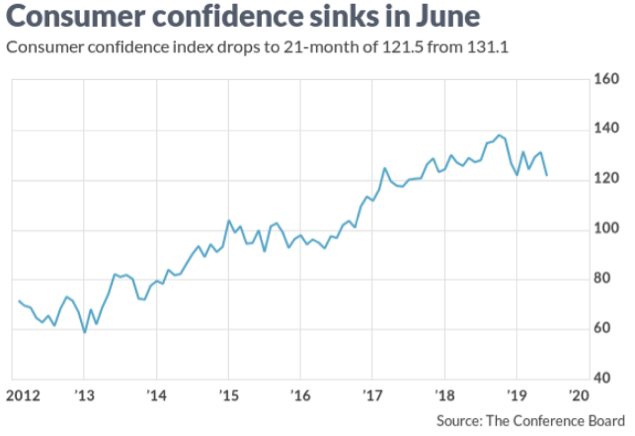
A measure of how Americans see the economy at present slid to a one-year low of 162.6 from 170.6. Part of the reason: More Americans said jobs were harder to get than in the prior month, 16.4% vs. 11.8 percent. Another gauge of consumers that looks out toward the next six months declined to a five-month low of 94.1 from 105.
“The escalation in trade and tariff tensions earlier this month appears to have shaken consumers’ confidence,” said Lynn Franco, director of economic indicators at board.”
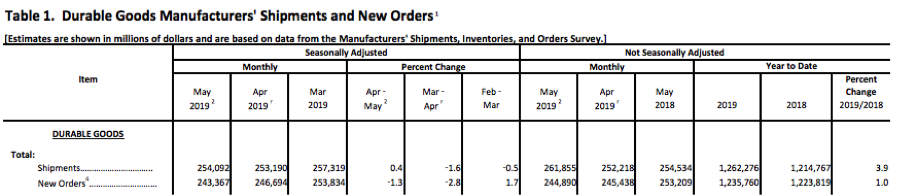
In addition to weakened Consumer Confidence and New Home sales, Durable Goods orders continued to decline MoM. Orders for long-lasting goods slid 1.3% last month, the government said Wednesday. If cars and planes are stripped out, orders actually rose 0.3% in April to break a string of three declines in a row. Transportation often exaggerates the ups and downs in orders because of lumpy demand from one month to the next.
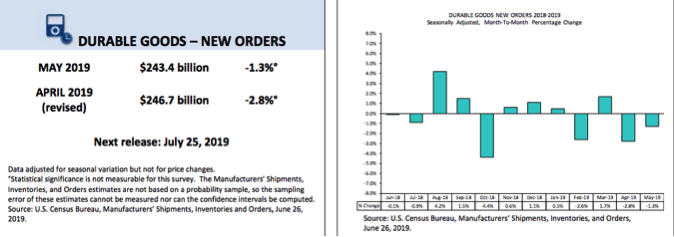
Orders for autos rose 0.6% in May. Orders also increased for heavy machinery, primary metals, computers and networking gear. A key measure of business investment, known as core orders, advanced 0.4% in May to mark the biggest increase since the first month of the year.
While new orders for Durable Goods fell MoM, it is important to denote that they continued to rise on a YoY basis by 1 percent.
The data deterioration didn’t stop there as Initial Jobless claims rose by 11, 000 last week, but remains at multi-decade lows. A lot of the data deterioration of late centers on trade flare ups with Mexico and the uncertainty of how trade relations with China would resolve at the G-20 Summit. With the uncertainty somewhat removed near-term, business spending may soon increase, with production cycles commencing for the back-to-school and subsequent Q4 holiday period.
The bright spot for the economic data in the past week was Pending Home sales and Consumer Spending. Pending home sales jumped by a seasonally adjusted 1.1% in May but were 0.7% lower than a year ago, the National Association of Realtors said Thursday. The May increase nearly doubled the consensus estimate for a 0.6% rise.
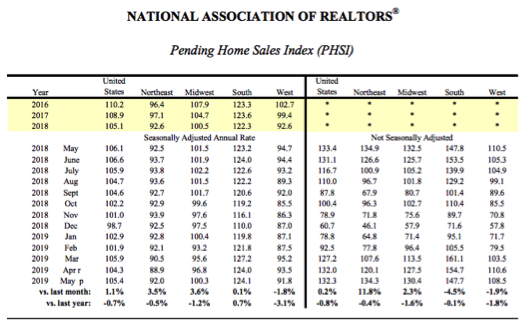
What I recognize in the greater amounts of housing sector data is that there is a clear rebound that has been correlated to lower interest rates and lower 30-year fixed mortgage rates. The 30-year fixed-rate mortgage averaged 3.73% in the June 27 week, down 11 basis points, Freddie Mac said Thursday. This is the lowest 30-year fixed rate in the last 30 months.
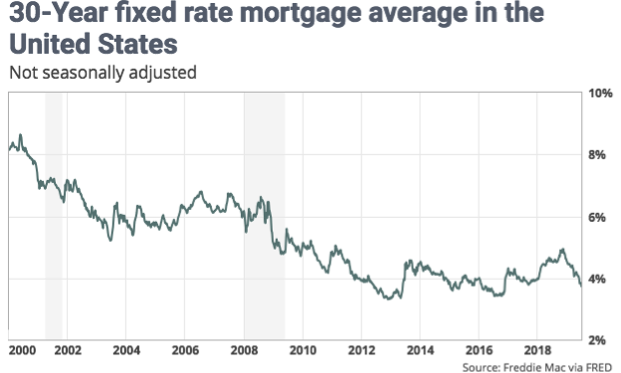
Finom Group expects low rates to prevail in 2019 and with home price appreciation moderating; this should also support a continuation of improving home sales. Keep in mind, the New Home, Existing Home and Pending Home sales comparison get easier in the back half of the year.
In truth, the economic data is weakening but they remain at trend-growth levels, normal and with economic/financial conditions relatively supportive and loose. The last piece of economic data for the week ended 6/29/2019 could be taken either way. The Personal Income and Expenditure (PCE) data is the main gauge of inflation utilized by the FOMC with regards to its inflation mandate and “symmetric 2% inflation target” objective. Here’s what we learned from the May PCE data:
- Consumer spending rose at a healthy clip in May for the third month in a row, suggesting the U.S. economy is still on solid ground even as growth has waned. Consumer spending increased 0.4% last month.
- The increase in spending in April was doubled to 0.6% from 0.3%, revised figures show.
- Incomes advanced 0.5% for the second month in a row to help support higher household spending.
- Although prices rose slightly in May, the pace of inflation over the past 12 months tapered off to 1.5% from 1.6% using the Federal Reserve's favorite PCE price gauge. That’s well below the Fed’s 2% target.

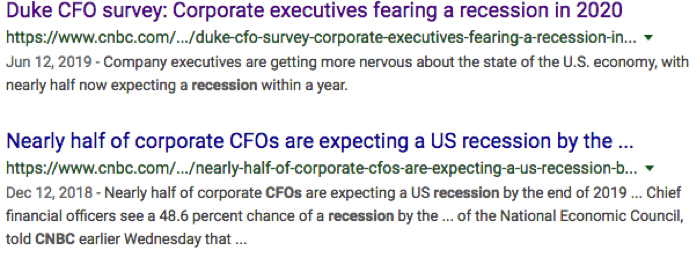
Consumer spending remains healthy, in spite of the ongoing trade feud and reduction in Capex spending. While businesses remain less confident than a year ago about the economy, consumers have been resilient with wages rising and job openings abundant. Speaking of business sentiment as it pertains to the economy, the latest Duke University CFO survey suggests the following:
- Some 48.1% of CFOs now see negative growth by the second quarter of 2020.
- The results show that 69% figure a recession will start before the end of next year, which is roughly consistent with the previous survey in April that showed 67% were anticipating a downturn by the third quarter of 2020.
I always like to put surveys and headlines such as this one into perspective. The fact is that CFOs are almost always nervous about economic conditions and the future of the economy. There sentiment seems to sway with the equity markets ebbing and flowing.
It’s good to be cautious I guess. But more importantly and as we revert to the latest PCE data showing that inflation continues to defy and remain well below the Fed’s target rate of 2%, the rate cut question comes back to the forefront. While many will put the trade truce before the proverbial rate cut horse, I feel the 2 were not linked directly in the first place. A rate cut was never truly dependent upon whether or not trade relationships improved. The Fed has a dual mandate: maximum employment and price stability. And lets face facts folks; a trade truce is not long-term progress. We’ve literally gone nowhere in this trade war and the Fed is still confronted with a trade truce that either will or will not find business spending improvement.
The market still very much believes the Fed will cut rates in July by at least 25 bps. It’s not only priced into Fed Fund futures, but it can be determined as part of the reason the market had rallied so strongly in the month of June and since the June FOMC meeting where the Fed removed the word patient and inserted the phrase “prepared to act in support of the economic expansion”.
Remember what happened last year also. Even though a temporary trade truce was enacted at the 2018 G-20 Summit in December, the market still tumbled.
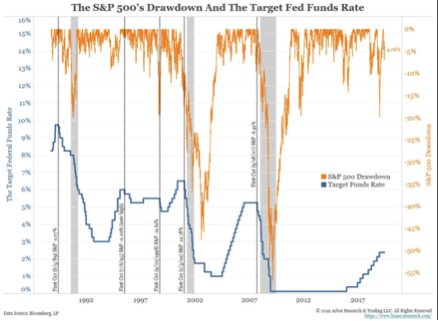
Notably, the difference this time is that central banks are providing a cushion for trade talks unlike the previous 3 times when financial conditions were tightening or in 2019 where the FOMC simply paused hikes. To reiterate, the market still anticipates a supportive Fed, which it believes will cut rates.
While the Fed has been successful in achieving maximum employment, price stability has evaded the Fed. Without price stability, deflation can extrapolate growth and profits from the economy and as such, the Fed will likely still find itself in need of cutting rates at the July FOMC meeting, given the continued weakness in core inflation data. A rate cut in July will likely steepen the front end of the yield curve, un-inverting the 3-month/10-year Treasury yields.
When it comes to what investors might expect from market returns after the first rate cut, it’s highly dependent on whether or not the rate cut is an insurance cut or a recession cut.

The last time the first rate cut led to consistently lower stock prices (and SPX wasn't already well on its way to a bear market) was nearly 40 years ago: the May 1981 rate cut came a half year after S&P 500 had peaked andwas barely out of a recession that had begun 17 months earlier. The 1974 rate cut came 7 months into a recession and a year and half after the peak in S&P 500. The 2001 rate cut came 9 months after the peak in S&P 500 when it was already down 15% and well on its way to a bear market. It's different this time, in a good way (from Isabelnet). And speaking of the S&P 500 peak, some might think the Fed can’t possibly cut rates with the S&P 500 currently at its peak. Think again…
As shown in the chart below, the Fed cut rates in 1995 with the S&P 500 right at its all-time high.
Next week is a holiday shortened trading week with Wall Street closed on Thursday for the 4th of July holiday. That doesn’t mean the economic data for the week will be any less abundant through the week.
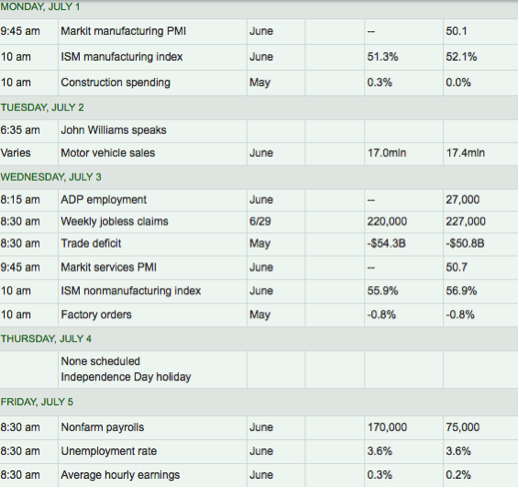
Probably the two most important pieces of economic data released this coming week will be on Monday with ISM manufacturing data and Friday with Nonfarm Payroll data. Both are expected to show YoY weakening trends. A large bounce back is expected in the June Nonfarm Payroll data from the May report, but ISM manufacturing is expected to slide lower, as a result of global trade weakening.
With global and domestic economic data weakening since May, analysts and Fed officials have been lowering their Q2 2019 GDP forecasts. The Atlanta Fed GDPNow was recently revised lower after the latest PCE data was released.
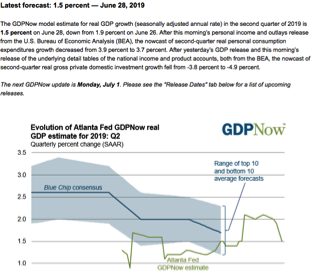
Goldman Sachs left their Q2 GDP forecast unchanged: The May core PCE price index increased 0.19% month-over-month, close to expectations, but the year-over-year exceeded consensus by a tenth reflecting the price revisions in yesterday’s GDP report. Personal spending increased by 0.4% and was revised higher in April, and the personal saving rate remained flat at 6.1%. We left our Q2 GDP tracking estimate unchanged at +1.5% (qoq ar).
As of June 28th, the CNBC Rapid Update estimate for Q2 GDP is as follows:
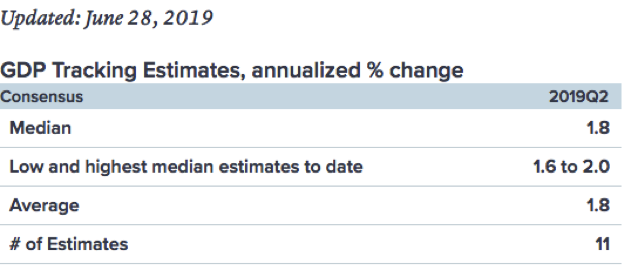
Fund Flows Improved
It hasn’t been terribly often in the last 9 months that I’ve been able to suggest an improvement in fund flows, but I digress. According to Lipper Weekly FundFlow data, for the second week in three, equity ETFs witnessed net inflows, taking in a little more than $5.0 billion for the most recent fund-flows week. Authorized participants (APs) were net purchasers of domestic equity ETFs (+$6.0 billion) for the third week in a row. Meanwhile, nondomestic equity ETFs witnessed net outflows for the seventh consecutive week, handing back $976 million this past week. Invesco QQQ Trust 1 (QQQ, +$2.6 billion) and iShares Core S&P 500 ETF (IVV, +$1.7 billion) attracted the largest amounts of net new money of all individual equity ETFs. At the other end of the spectrum, SPDR S&P 500 ETF (SPY, -$1.8 billion) experienced the largest individual net redemptions and iShares Russell 2000 ETF (IWM, -$846 million) suffered the second largest net redemptions of the week.
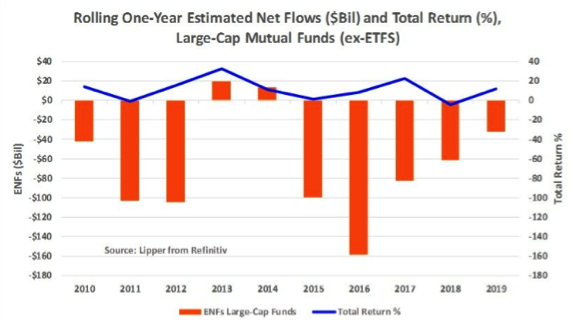
For the fund-flows week ended June 26, small-cap funds were the pariah of the domestic equity funds universe, handing back $1.6 billion, while large-cap funds suffered net redemptions of $832 million. Interestingly though, if we break out fund flows by product type, we see that investors appear to be turning their backs on large-cap mutual funds, while embracing large-cap ETFs.
For the most recent fund-flows week, large-cap funds experienced net redemptions of $3.6 billion, their twentieth consecutive week of net outflows. Meanwhile, large-cap ETFs attracted $2.8 billion, their third consecutive week of net inflows.
Large-cap funds are comprised of the following domestic Lipper classifications: Large-Cap Growth Funds, Large-Cap Core Funds, and Large-Cap Value Funds, but the group does not include Lipper’s S&P 500 Index Funds classification.
The main reason that equity ETFs continue to outperform with regards to fund flows is the gravitation to passive investing strategies. Passive investments such as index funds and exchange-traded funds control about 60% of the equity assets, while quantitative funds, those which rely on trend-following models instead of fundamental research from humans, now account for 20% of the market share, according to estimates from J.P. Morgan.
This means so much of stock trading is now in the hands of automated buyers and sellers that the market is increasingly sensitive to headlines and more prone to sharp price swings, many notable investors believe.
While algorithmic models have gained popularity on Wall Street, low-cost passive vehicles keep raking in assets from Main Street. Passive funds have attracted $39 billion of inflows so far this year, whereas active funds lost a whopping $90 billion in 2019.
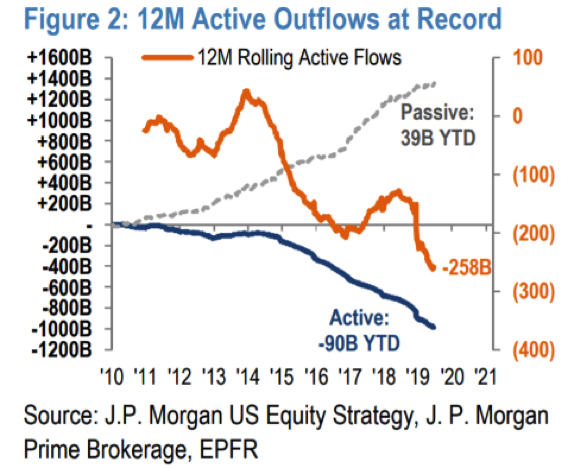
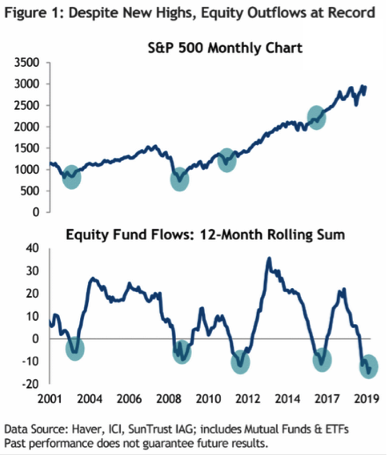
It’s hard to look at the following chart and understand how the market continues to defy fund outflows that are at their highest levels since the Great Financial Crisis.
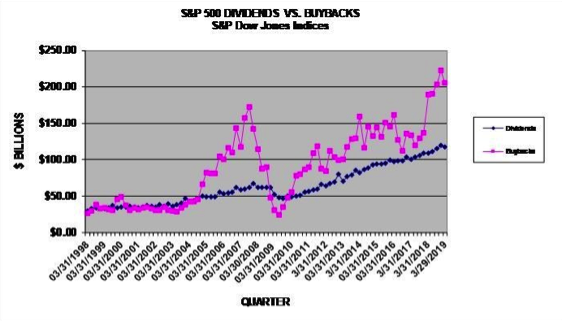
To the extent that I replicate and discern fund flow activity every week, the reality is that we fully recognize the greatest buyer of equities over the last couple of years has been corporations. In terms of the buyback season during the Q1 2019 period:
- Q1 2019 share repurchases were $205.8 billion - 7.7% lower than the record Q4 2018 but 8.9% higher year-over-year.
- Apple sets another index record, spending $23.8 billion in buybacks for the quarter; company accounts for eight of the top ten record quarters.
- Buybacks for the 12-month period ending in March 2019 were a record $823.2 billion, up 43.1% year-over-year.
- One in four companies used buybacks to reduce their share count by at least four percent.
Buybacks continue to be top heavy, with the top 20 issues accounting for 51.2% of the buybacks. For the 12-months ending March 2019, the top 20 issues represented 41.4% of all buybacks, compared to 36.1% for the 2018 period. On an issue level, 389 issues reported buybacks for Q1 2019, down from 404 in Q4 2018 and 397 in Q1 2018. For the 12 months ending March 2019, 442 issues reported buybacks compared to 431 for the comparable 2018 period. The five issues with the highest total buybacks for Q1 2019 are:
- Apple (AAPL) again led in buybacks spending a new record $23.8 billion in Q1 2019, up from $10.1 billion spent for Q4 2018. Apple holds 8 of the 10 records for quarterly buybacks, spending $75.1 billion on buybacks over the past year, $234.7 billion over the last five-year period, and $284.3 billion over the last 10-year period.
- Oracle (ORCL): $10.0 billion for Q1 2019, a tick up from their Q4 2018 expenditure; in the last 12 months they spent $35.3 billion, up from $7.4 billion.
- Pfizer (PFE): $8.9 billion for Q1 2019, up from the $5.0 billion spent in Q4 2018; in the last 12-months they spent $15.0 billion, up from $6.1 billion.
- Bank of America (BAC): $6.3 billion for Q1 2019, up from $5.2 billion for Q4 2018; in the last 12-months they spent $21.5 billion, up from $14.9 billion.
- Cisco Systems (ORCL): $6.1 billion for Q1 2019, up from $5.2 billion for Q4 2018; in the last 12-months they spent $22.8 billion, up from $13.4 billion.
In addition to the displayed context and statistics pertaining to buybacks, the latest CCAR results now permit major banks to return more capital to shareholders after passing the Fed’s stress test. It wasn’t more than a few hours after passing the Fed’s stress test that big banks announced their new capital return plans.
- Goldman Sachs boosted its quarterly dividend by nearly 50% to $1.25 a share, from 85 cents a share, and authorized a $7 billion stock repurchase program, up from $5 billion a year ago. The bank’s shares rose 2.2% in the premarket Friday.
- J.P. Morgan Chase lifted its dividend by 13% to 90 cents a share from 80 cents a share. The bank also can repurchase up to $29.4 billion in stock under a new program, compared to $20.7 billion last year. J.P. Morgan shares rose 1.9%.
- Bank of America increased its dividend to 18 cents a share from 15 cents and can repurchase up to $30.9 billion in stock. Wells Fargo raised its dividend to 51 cents a share from 45 cents and can buy back $23.1 billion in shares. Bank of America’s stock climbed more than 2% while Wells Fargo advanced 1.7%.
- Citigroup boosted its dividend to 51 cents a share from 45 cents and can repurchase $21.5 billion in stock. Morgan Stanley hiked its dividend to 35 cents a share from 30 cents and can buy back $6 billion in stock. Citigroup shares gained 1.9% while Morgan Stanley advanced 1.8%.
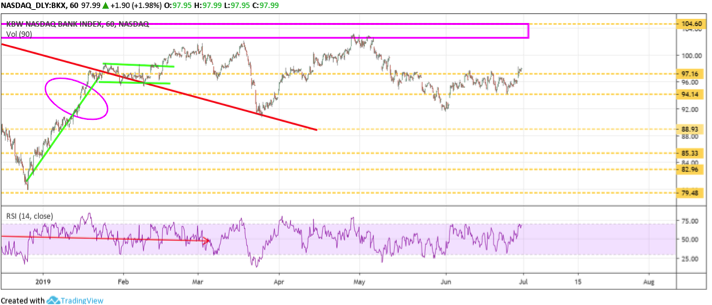
Furthermore, J.P. Morgan has flagged the Banking sector (BKX) as a potential outperformer in the back half of the year, in part, due to the newly announced capital return plans. Their notes are as follows:
1) underperformance– the BKX has been a notable laggard vs. the SPX since the market rebound off the Dec sell-off
2) positive capital return – the stress test results (Fri night 6/21) and capital return announcements (Thurs night 6/27) were positive in aggregate (BAC, C, JPM, and WFC alone will be repurchasing ~$100.6B worth of stock in the next four quarters
3) deposit cost price pressures may be abating (albeit only slightly) – two of the more aggressive banks when it comes to pricing deposits (Marcus and Ally Financial) both announced this week they would be trimming back the yield offered on savings accounts
4) the Fed is having some success in steepening the curve (for now) – rising expectations for Fed easing has helped to steepen out the curve as FOMC-sensitive 2yr yields fall by more than the longer end of the curve (which is more sensitive to nominal growth expectations)
5) the tone from mgmt. presentations at the recent MS conf. wasn’t awful – while a few firms did talk down guidance at the MS conf. (including the trust banks and WFC), the plain vanilla banks signaled Q2 was largely tracking to plan (with the NIM pressure no worse than feared). CQ2 bank earnings kick off Mon 7/15.
The BDX outperformed the broader market on Friday, up nearly 2%, for known reasons related to the capital return announcements. We can see that the index is slowly rising over resistance at 97. It could lead to the index even increasing towards 104.
Q2 Earnings
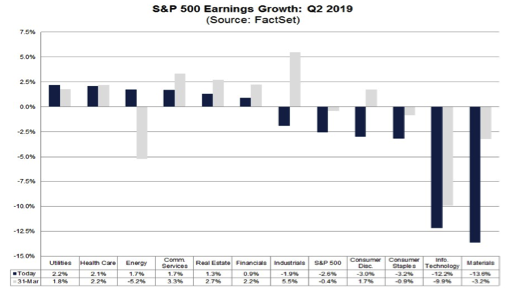
We still have a couple of weeks to go before the Q2 2019 earnings season begins in earnest, but the reporting cycle has actually gotten underway already. We have a lite reporting docket this coming week because of the July 4th holiday, but results from 20 S&P 500 members have been delivered already. FactSet is forecasting Q2 2019 EPS to decline by -2.6%, unchanged from the previous week.
The Information Technology sector is expected to report the second highest (year-over-year) earnings decline of all eleven sectors at -12.2%. At the industry level, two of the six industries in this sector are predicted to report a decline in earnings: Semiconductors & Semiconductor Equipment (-33%) and Technology Hardware, Storage, & Peripherals (-22%). On the other hand, four industries are projected to report earnings growth, led by the Communications Equipment (5%) and Software (5%) industries.
Driving the Tech sector’s weak earnings growth expectation for the quarter is Apple (AAPL) and the broader semiconductor space. For Apple, June quarter earnings are expected to be down -15.4% on +0.1% higher revenues. The semiconductors industry has been struggling for the last few quarters and this trend is expected to continue in Q2 as well. The expectation is that the semiconductor industry’s earnings declines bottom in Q2 and start improving from Q3 onwards.
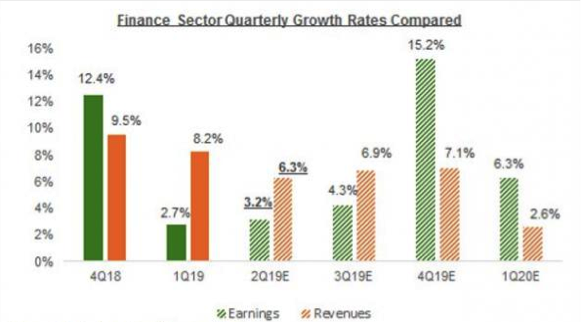
The major banks, the group that includes the big money-center operators like JPMorgan (JPM) that kicks off the reporting cycle for the sector on July 16, is expected to -4.1% lower earnings on +1.8% higher revenues.
While FactSet and Zack’s Research both forecast an earnings decline in the Q2 2019 period, Reuters/Refinitiv forecasts an earnings increase of .03 percent. The estimated earnings growth rate for the S&P 500 for Q2 2019 is 0.3%. This is actually an improvement of .1% from the prior week. If the energy sector is excluded, the growth rate improves to 0.4%. The S&P 500 expects to see share-weighted earnings of $332.7B in 19Q2, compared to share-weighted earnings of $331.8B (based on the year-ago earnings of the current 505 constituents) in 18Q2.
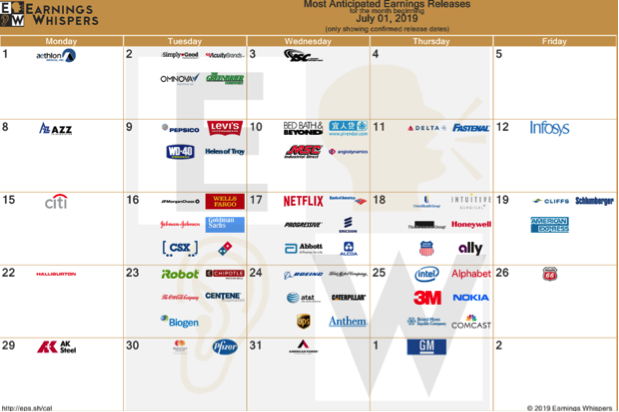
For the coming week, there really aren’t any anticipated earnings releases. For the month of July, the following calendar supports the confirmed earnings release dates.
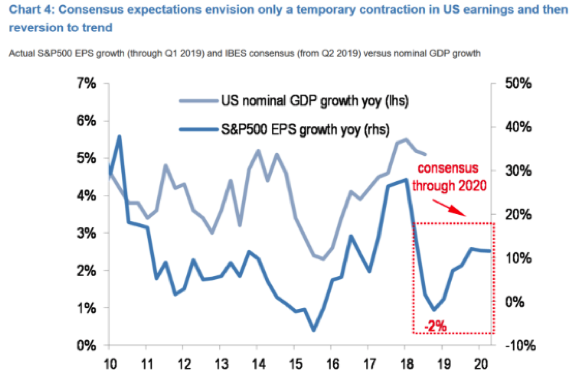
With respect to the earnings outlook, it’s important to keep in mind that the equity market is a forward-looking pricing mechanism. As such, investors are investing for future earnings, not even present earnings results. With that in mind, if we look out to 2020 earnings’ estimates it may put present market valuations into perspective. (See chart below from JPM)
Investor Takeaways
For the coming week, there are only 3.5 trading days and crammed into those 3.5 trading days are very relevant and Fed-relatable economic data points on the labor and employment front. Additionally, the coming week is the kick-off of the Q3 2019 period that is underpinned with a trade truce and pretty much all asset classes proving to have risen in 2019. So where are the bargains; there are very few outside of the financials, semiconductors, banking and possibly an overheated IPO market that will eventually fall prey to short-sellers and profit taking. Think Beyond Meat (BYND) folks.
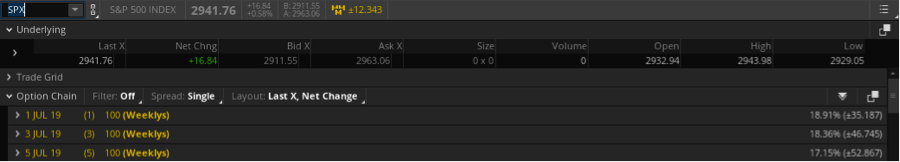
With the aforementioned in mind, the weekly expected move for the S&P 500 is rather high given the fact that the VIX fell 2% in the past trading week. The weekly expected move is roughly $53/points. What’s even more eye-opening is that Monday alone has an expected move of $35/points.
The U.S. economy is still growing and is supported by FOMC monetary policy and loose financial conditions. Financial conditions are one of the most critical aspects of the health of financial markets.


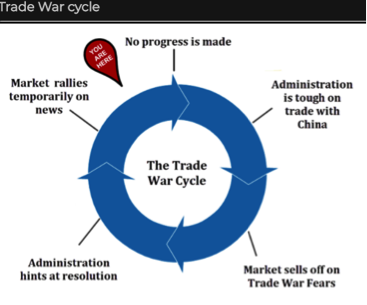
it's nice that they keep willing to negotiate with trade talks... until they break off again.
So Seth, Tariff Man cannot help himself. He is back destroying goodwill as he threatens Europe. The Chinese and Europe should abandon the USA isolationism and grow closer. China will never trust the US again. Trump is destroying the US economy. It will show up if he does not back off.
I don't agree with his methodologies, but destroy the economy in 4 years seems unlikely. Much that has been undone and then instituted (tariffs) by the administration can just as easily be undone by the next. He'll back off in due time as noted in the article, just a place cardholder until the time is right.
I sincerely hope you are right. Historically, tariffs seem to stick. Even if he loses the election it is likely that a tariff warrior will come from the Democrats.
I was actually wondering about that Gary. Are there any stats on how often #tariff decisions are overturned when there is a change in administrations?
I think there is little info. It appears that tariffs are kept on certain products and industries. We know Democrats seem to be for tariffs. Some were angry that Trump gave Huawei a pass! This article goes into the problems that occur with tariffs:
taxfoundation.org/impact-of-tariffs-free-trade/
Theres little history regarding tariff implementation and using history isn't likely the appropriate way to rationalize given this the first occurence with a truly globally intertwined economy.