
![]()
The August Trade Deficit fell for a fifth straight month to -$67.4B. The Deficit is now down an incredible 37% from the high struck back in March.
As shown by the chart below, this is mainly driven by a fall in Imports as Exports have stayed relatively flat.
(Click on images to enlarge)
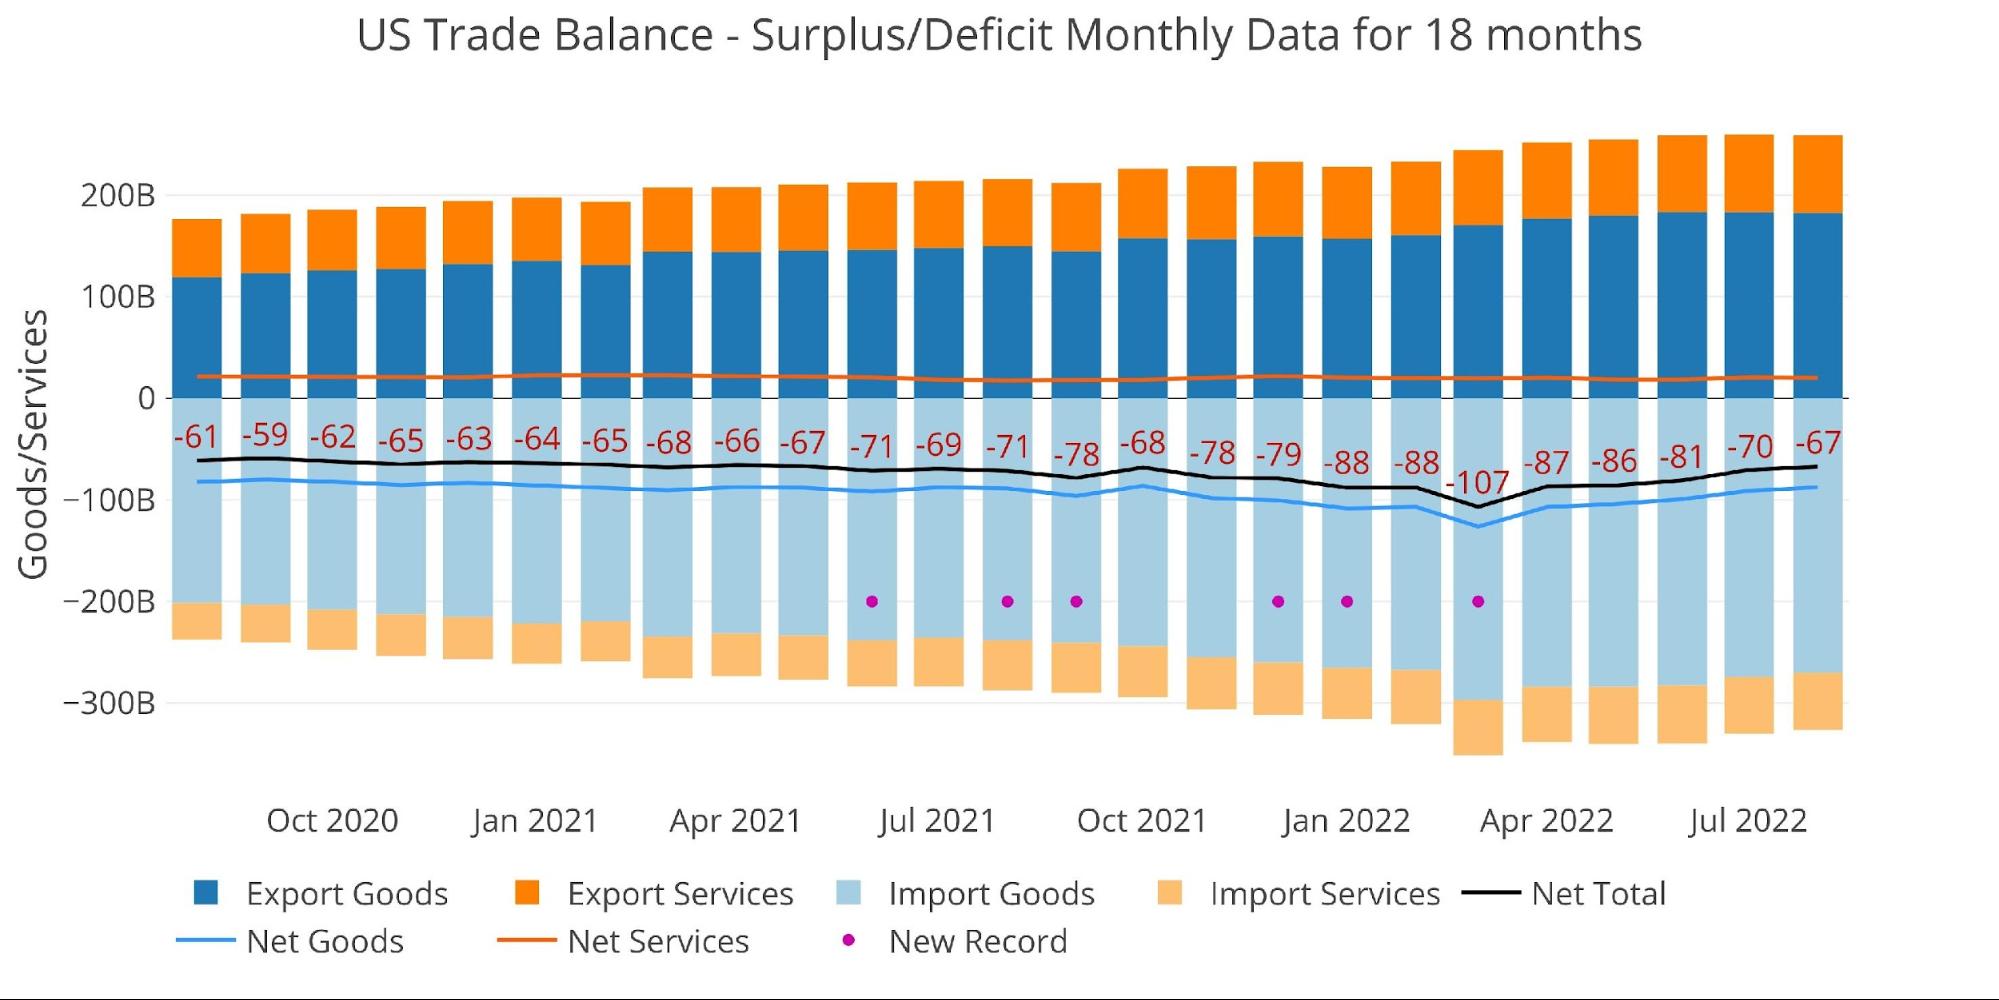
Figure: 1 Monthly Plot Detail
The table below provides detail.
Monthly Trade Deficit
-
- MoM Imported Goods are down 1.5%
-
- Exported Goods are also down slightly 0.4%
-
- On a net basis, the Goods Deficit is down 3.8% MoM but also down 1.2% YoY
-
- The YoY fall is mainly driven by Exports increasing more than Imports
-
- The Services Surplus fell slightly MoM by 1.8%
- MoM Imported Goods are down 1.5%
Looking at Trailing Twelve Month:
-
- The TTM Net Deficit fell slightly from -$981B last month to -$977B
-
- YoY, the TTM Deficit is still up 23.6% from -$790B
-
- The TTM Services Surplus continues to shrink and is down almost 6% since last August
- The TTM Net Deficit fell slightly from -$981B last month to -$977B
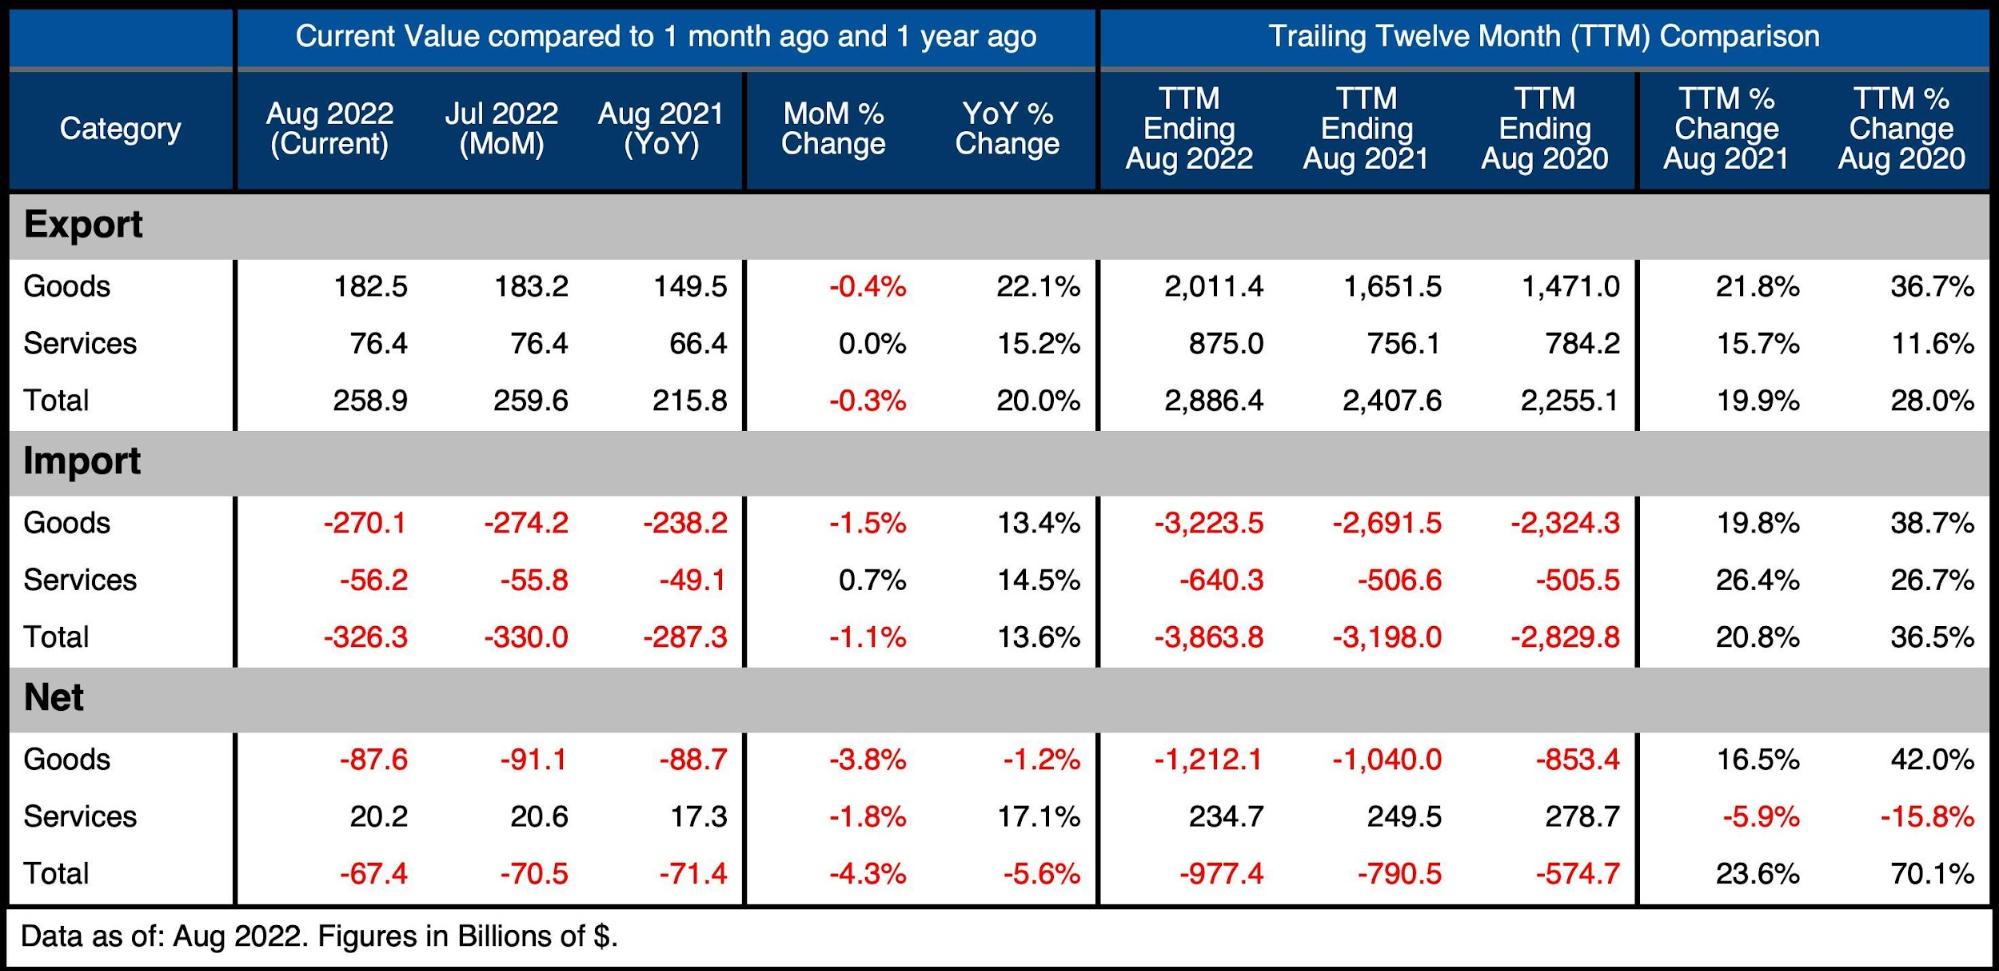
Figure: 2 Trade Balance Detail
Historical Perspective
Zooming out and focusing on the net numbers shows the longer-term trend. The massive Deficit spike in March has fully reversed. The last time the Trade Deficit collapsed so quickly was in 2008. While the current August Deficit has come down from recent months, it would have been the largest monthly Deficit ever had it registered back in May of last year.
In 2008 the Deficits touched -$67B before reversing sharply as the recession took hold. Looking at the chart below shows that a similar snapback reversal is occurring now, but much more violently than it did back in 2008.

Figure: 3 Historical Net Trade Balance
The chart below zooms in on the Services Surplus to show the wild ride it has been on in recent months. It compares Net Services to Total Exported Services to show relative size. After hovering near 35% since 2013, it dropped below 30% in July last year. It now sits at 26.5%.
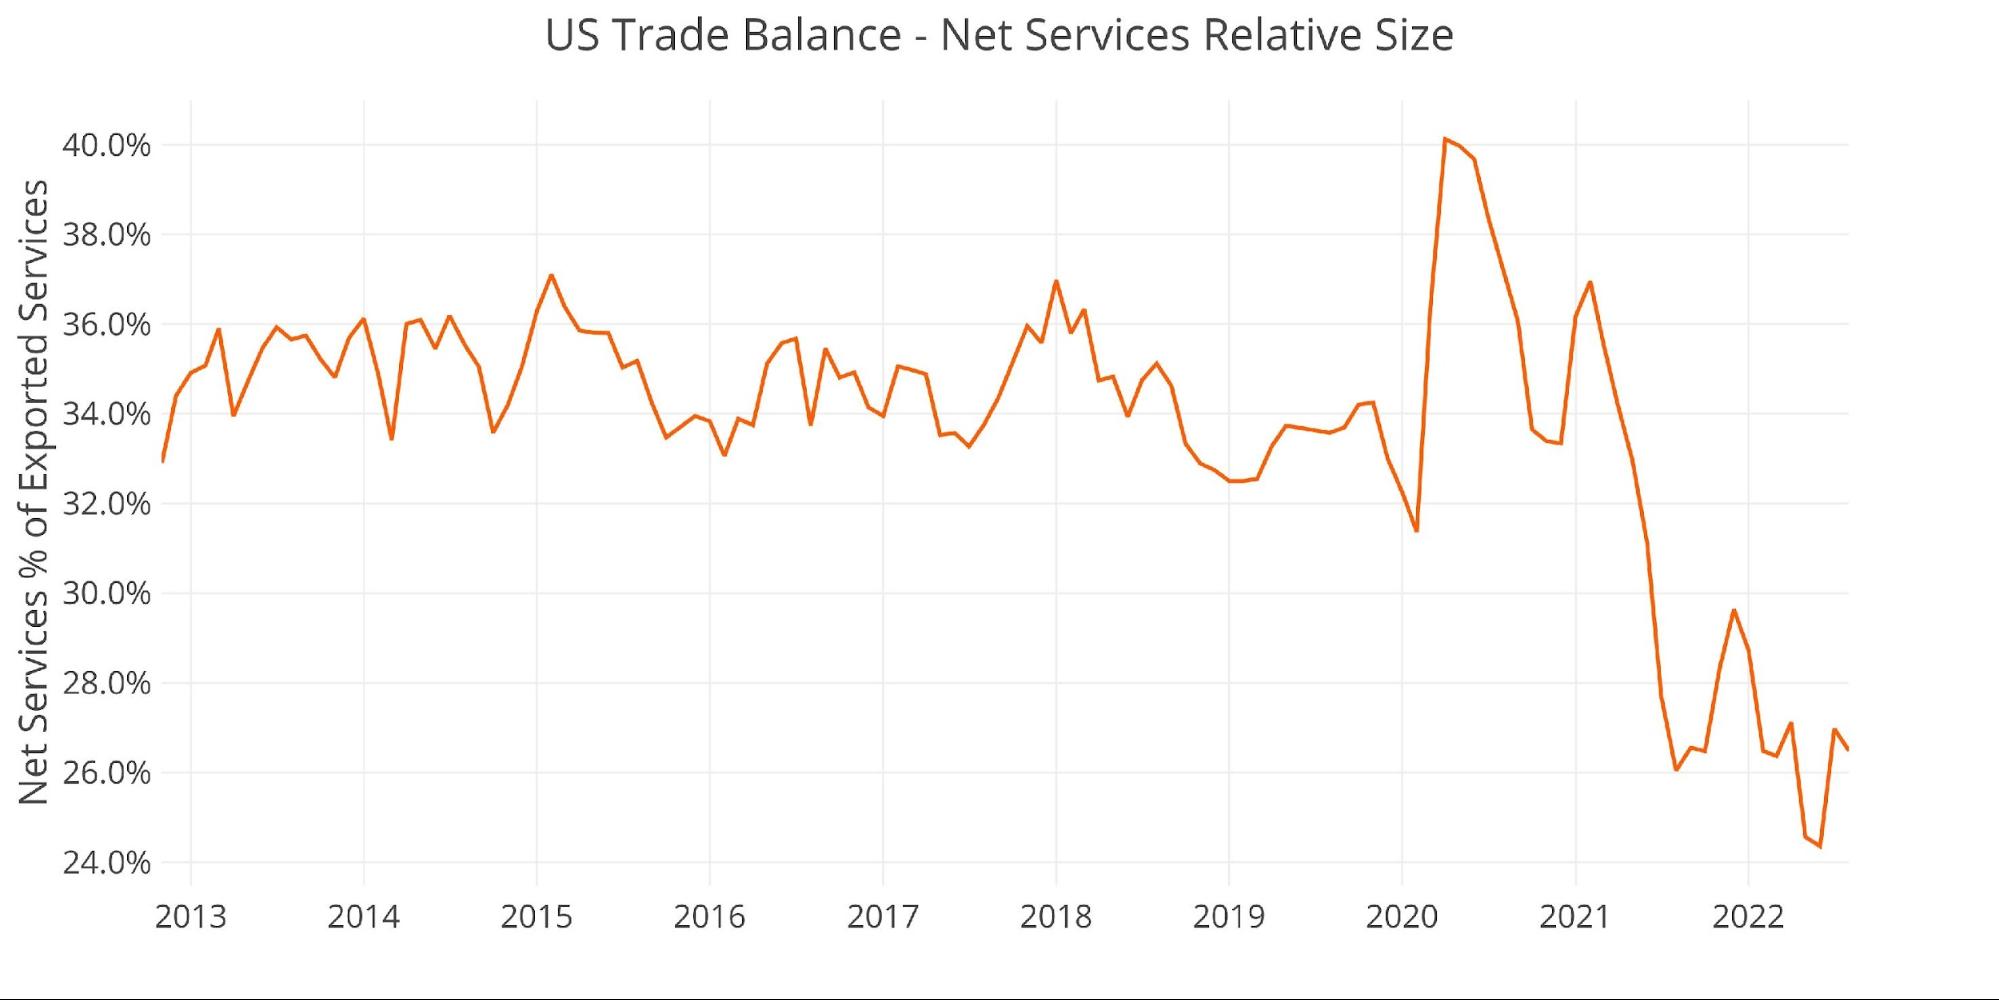
Figure: 4 Historical Services Surplus
To put it all together and remove some noise, the next plot below shows the Trailing Twelve Month (TTM) values for each month (i.e., each period represents the summation of the previous 12 months).
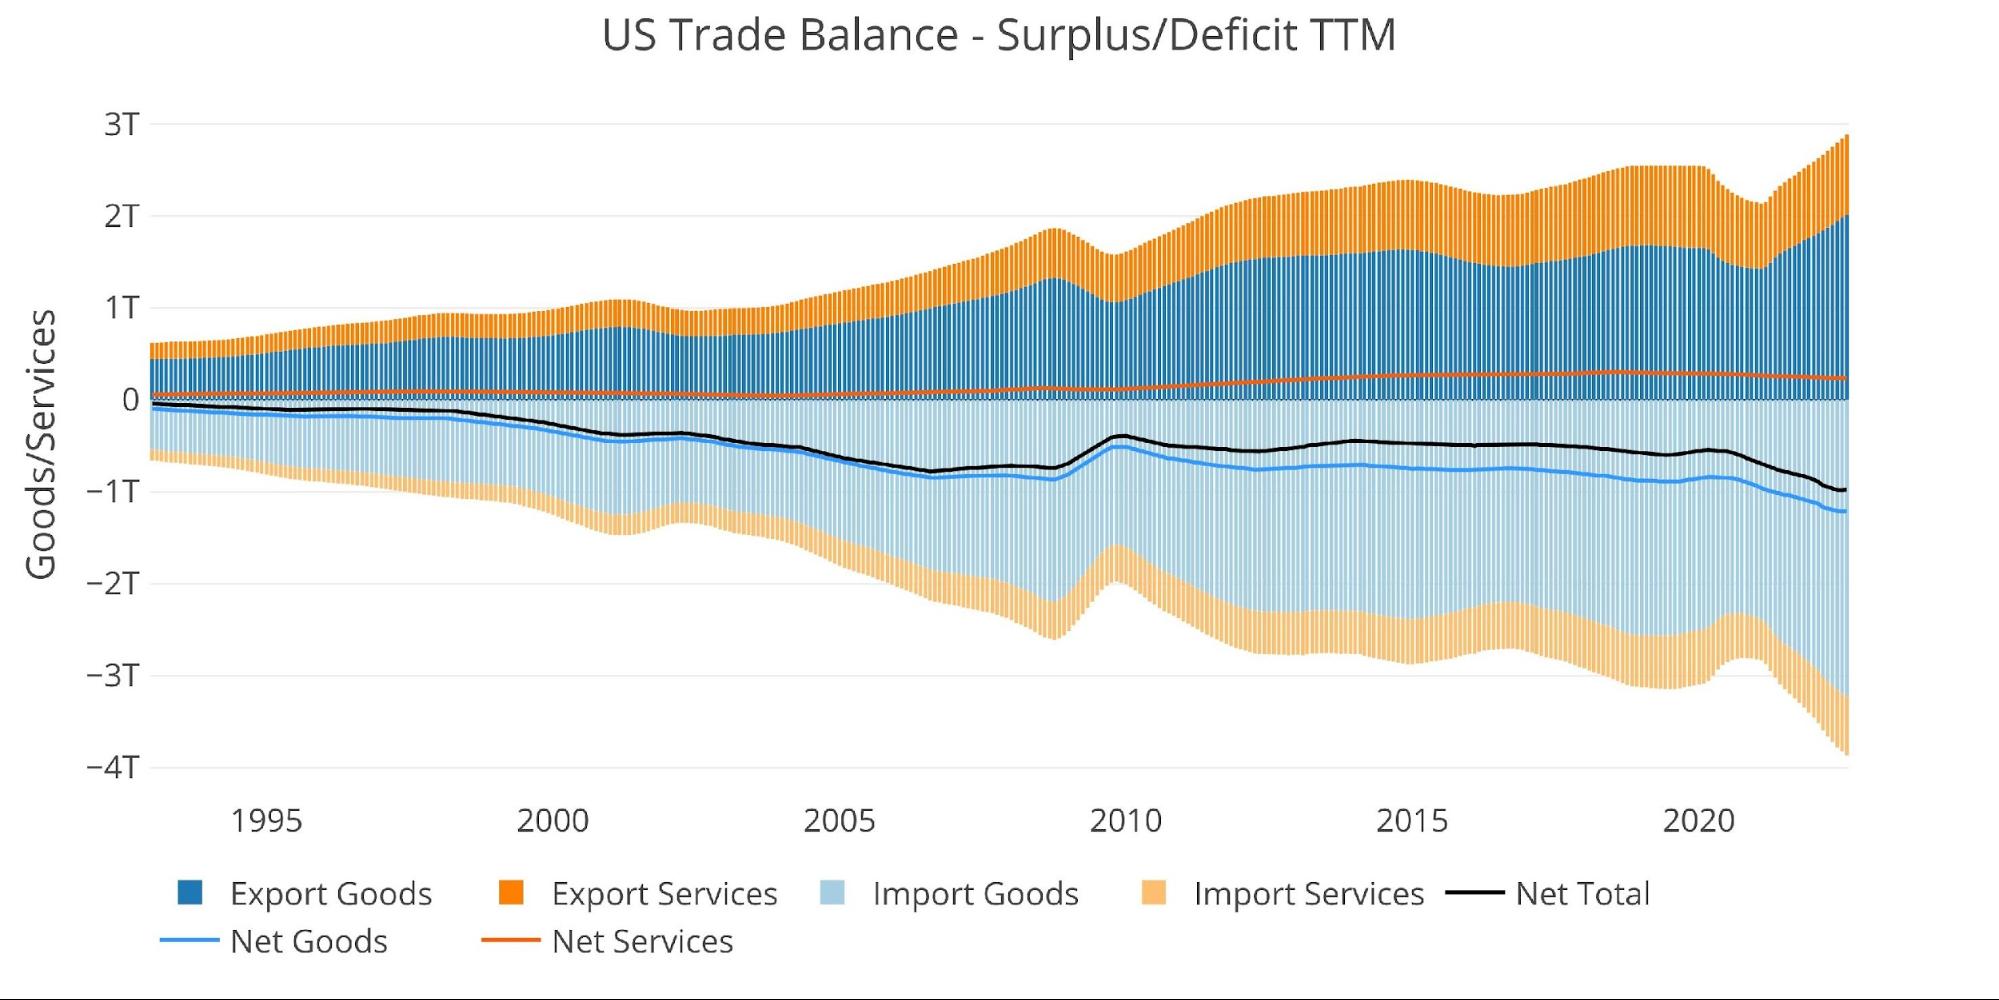
Figure: 5 Trailing 12 Months (TTM)
Although the TTM Net Trade Deficits is near historical highs, it can be put in perspective by comparing the value to US GDP. As the chart below shows, the current records are still below the 2006 highs before the Great Financial Crisis.
That being said, the current 3.87% is near the highest since April 2009 and up from 2.53% in March 2020.
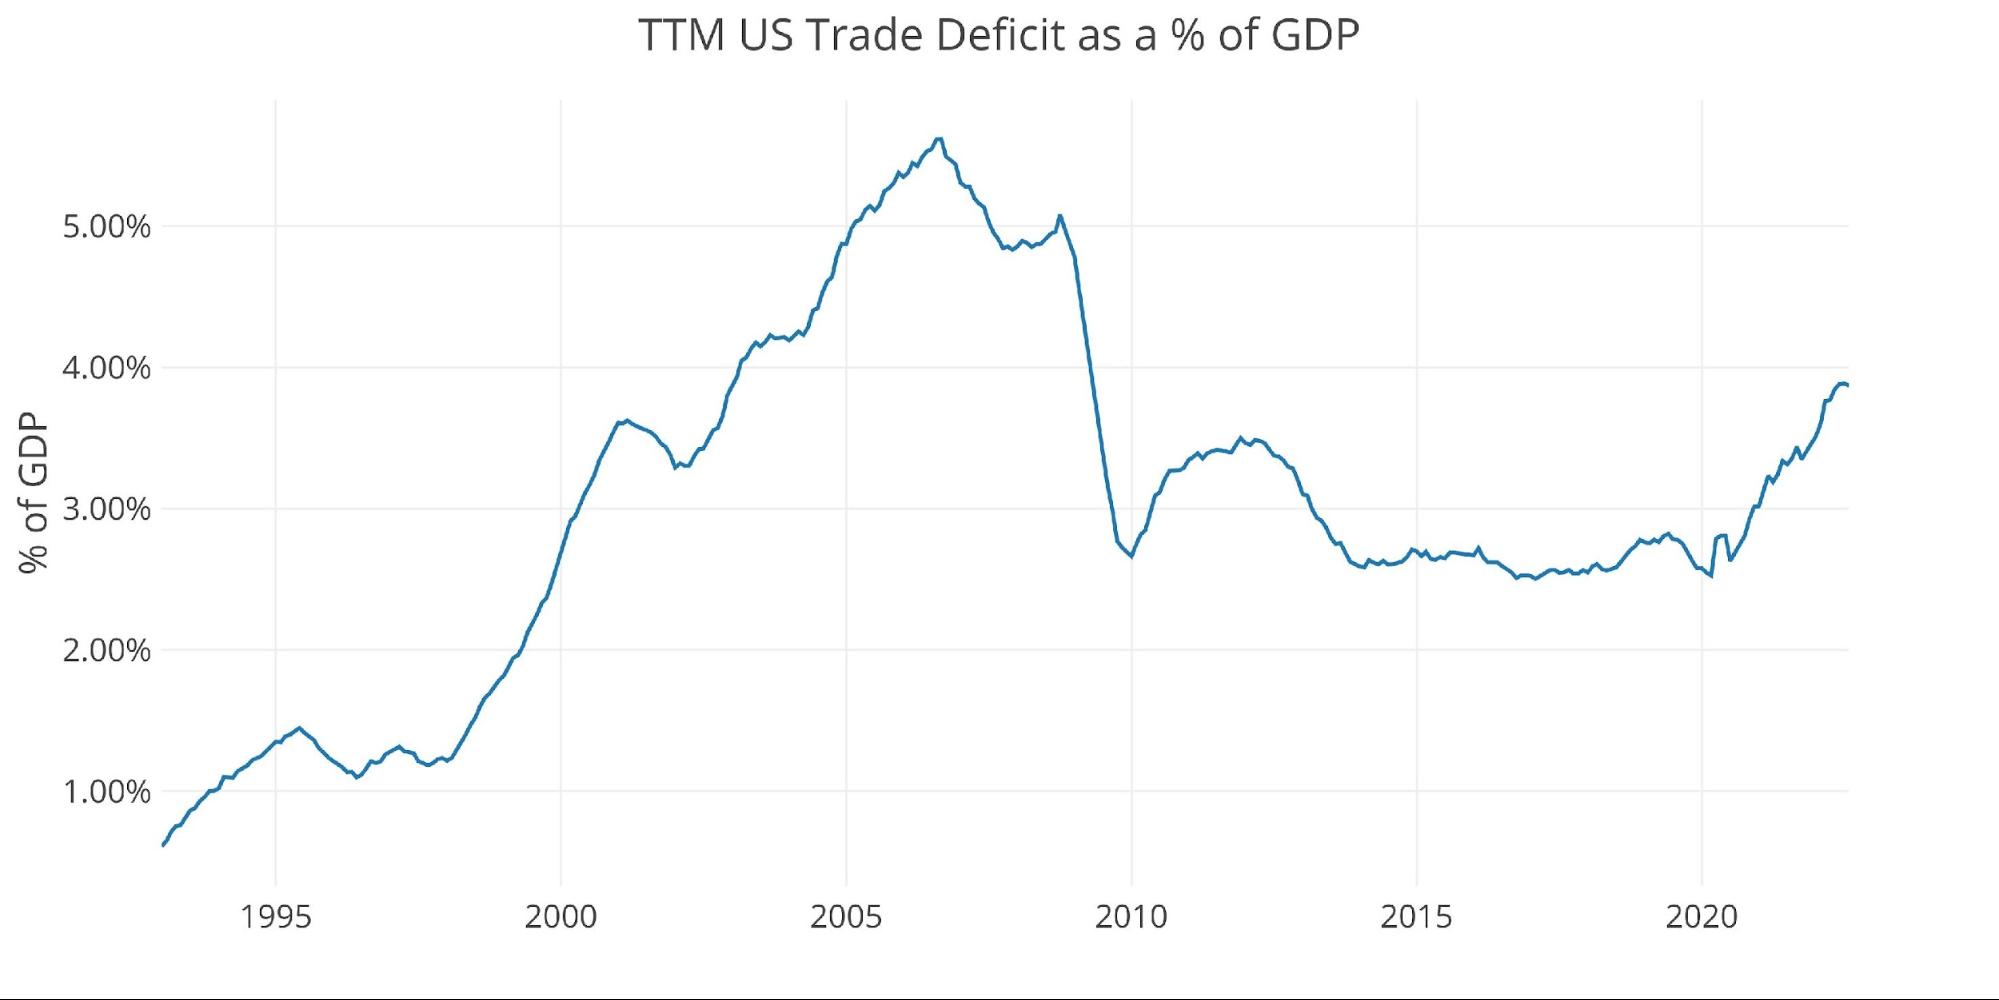
Figure: 6 TTM vs GDP
The chart below shows the YTD values. 2022 is well above prior years by a significant margin. Even though Exports have surged this year, it has been offset by even bigger increases in Imports.
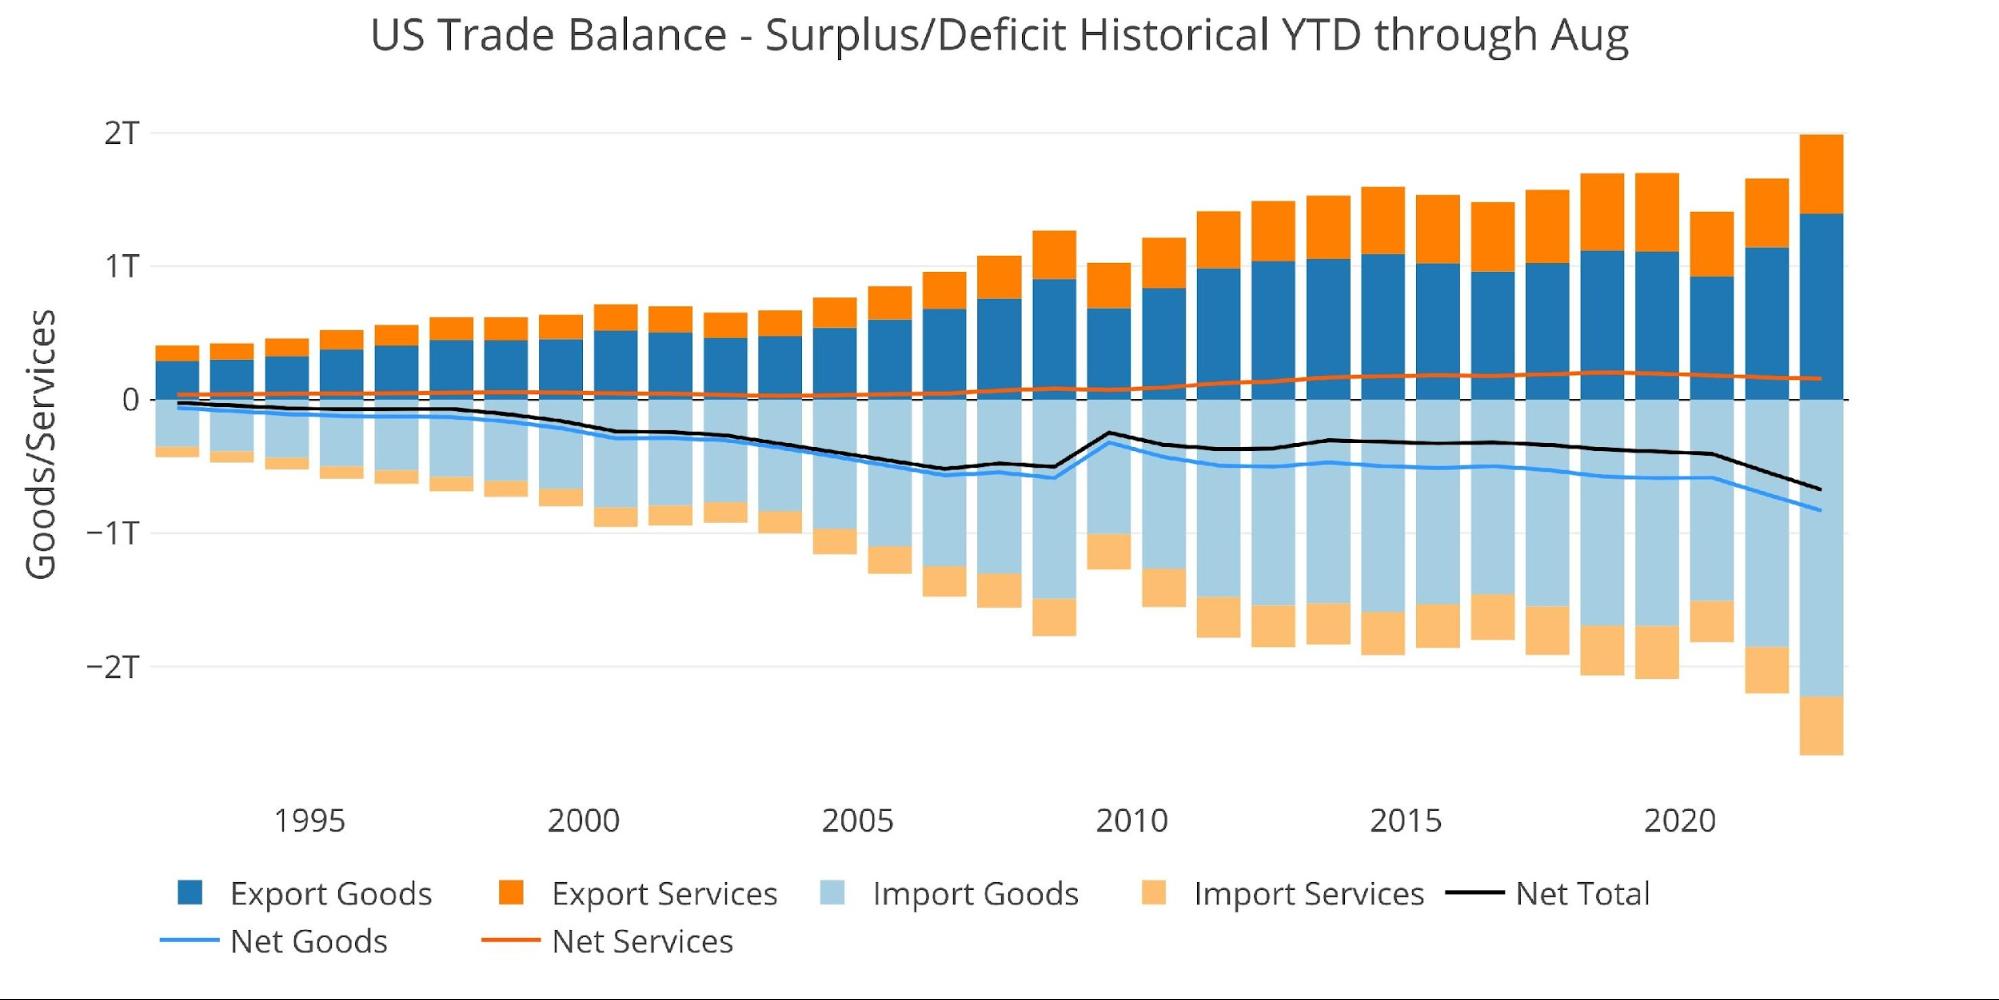
Figure: 7 Year to Date
What it means for Gold and Silver
The current trend in the Deficit can be interpreted in multiple ways. On the one hand, it’s good the Deficit has been falling in recent months. However, it’s still historically high and the fall could be another sign of the weakening economy.
Another possible explanation is the significant surge in the dollar which would equate to the same basket of goods costing less. The rest of the world is getting squeezed by the strong dollar, having to ship US goods for fewer dollars each month.
Eventually, other countries will be fed up with the dollar reserve status and the extreme privilege it grants to the US. When this happens, goods will stop flowing into the US as the dollars purchasing power crashes abroad. For people who want to maintain or potentially increase their standard of living, gold and silver offer excellent protection.
Data Source: https://fred.stlouisfed.org/series/BOPGSTB
Data Updated: Monthly on one month lag
Last Updated: Oct 05, 2022, for Aug 2022
US Debt interactive charts and graphs can always be found on the Exploring Finance dashboard: https://exploringfinance.shinyapps.io/USDebt/
More By This Author:
National Debt Blows Passed $31 Trillion! So What?UN Agency Warns Of Global Recession Due To Tightening Monetary Policy
CoTs Report: Managed Money Hammers Gold For 7th Straight Week


Comments
Log in or sign up to join the conversation.