
Trade & Policy Turn Ugly & Markets Follow
Given the state of macro-affairs that are bleeding into the market outlook, this week's Research Report will discuss the implications for investors going forward, and largely forgo subject matters related to fund flows as we continue to recognize a flight out of equities and into bonds that has been persistent for the last 3 years. These flows have contributed to the yield curve inversion and most overbought conditions in the bond market in several decades. With our baseline established, last week was set to break a 3-week losing streak for the major averages until the tit-for-tat flares were sent up once again.
All Things S&P 500

Stocks ended sharply lower Friday as the U.S.-China trade war intensified further after President Donald Trump said he’s ordering American companies to start looking for “an alternative to China,” while readying additional measures after Beijing imposed retaliatory tariffs on imports of U.S. goods.
The President was responding to China announcing new tariffs of 5% and 10% on $75 billion in U.S. imports, set to go into effect in two tranches, on Sept. 1 and Dec. 15, respectively. The Chinese government said that the move was in response to the Trump administration’s plans to institute 10% tariffs on $300 billion in Chinese imports, also in two stages and on the same dates, announced earlier in August.
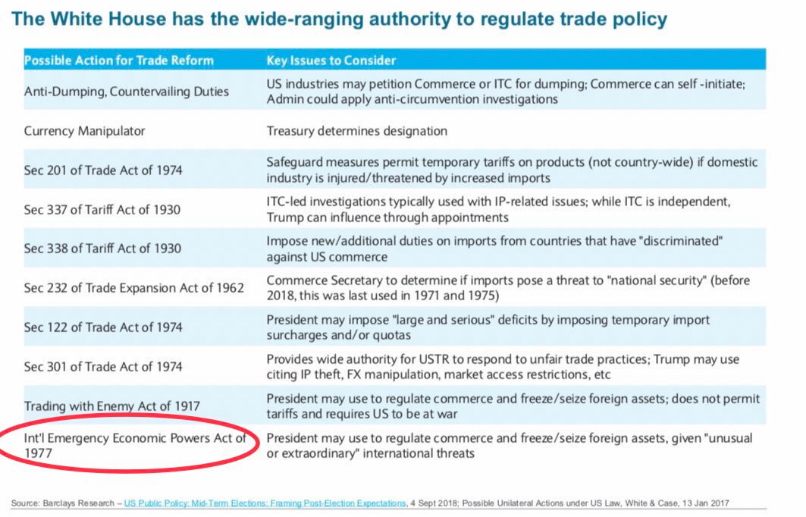
With respect to the President's remarks aimed at U.S. companies, the President cited the International Emergency Economic Powers Act of 1977, the same rule he used to justify his threat of tariffs on Mexico in May.
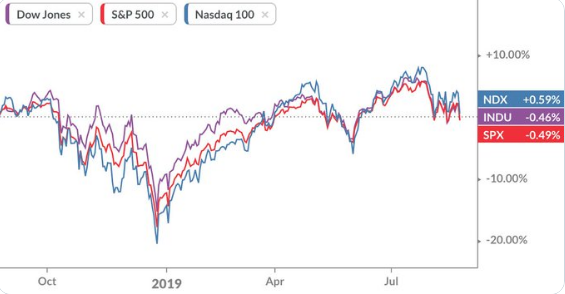
The drop in the markets, after the President's tweets, left the major indexes with their fourth consecutive weekly loss, with the Dow (DJIA) down 1% since last Friday, while the S&P 500 (SPX) saw a 1.4% drop and the Nasdaq (NDX) declining 1.8 percent. If we get another down week next week in the S&P 500, well, that has only happened once in the past 10 years, and not at all since May/June 2011. Additionally, the strength that had been building throughout the week was finding many of the index ETFs climbing toward their 50-DMA and out of oversold territory.
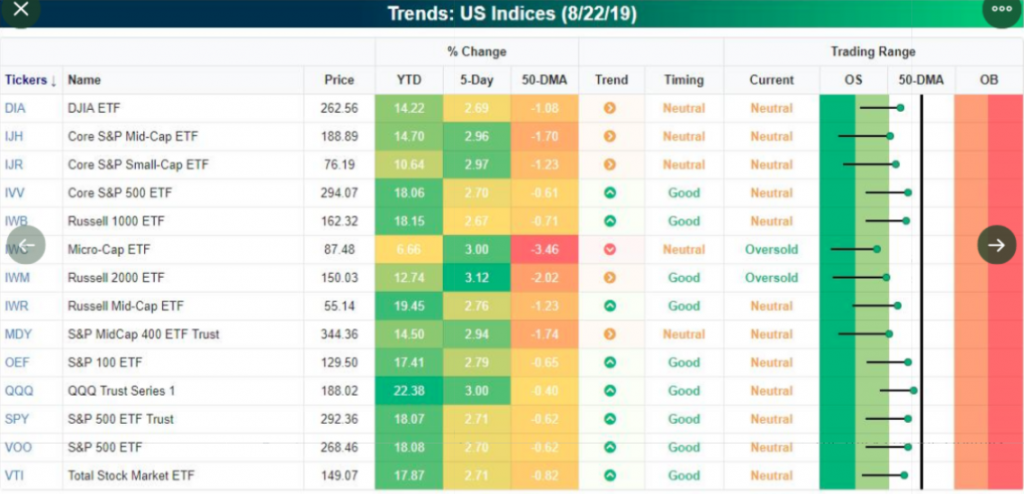
But of course, that momentum was lost shortly after the tweetstorm that sent the major averages reeling, as depicted in the Bespoke Investment Group Trend Analyzer below:

That's how quickly both fundamental and technical analysis can breakdown, with a tweet. While the S&P 500 fell more than 2.5% on Friday, giving up the week-to-date gains, it still remains range-bound over the last several weeks and hovering between the 100 & 200-DMAs.
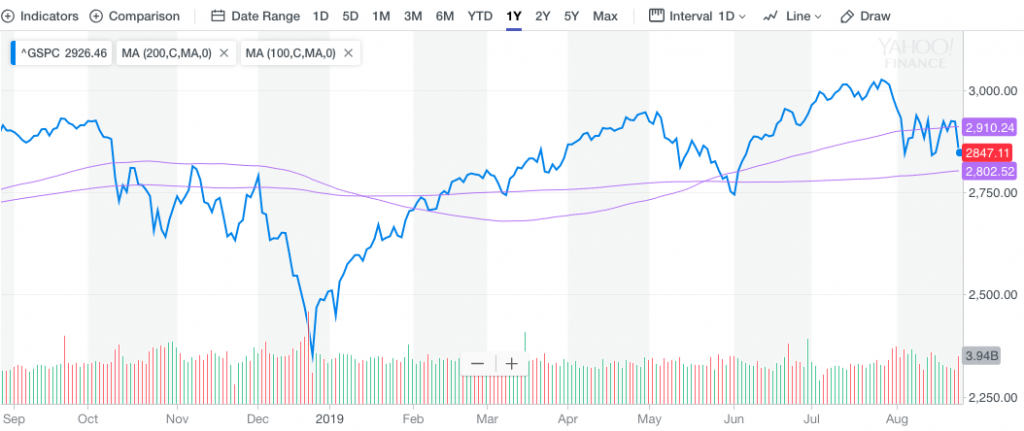
Given the geopolitical backdrop, relative weak close for the S&P 500 and lacking the ability to break back above the 50-DMA since late July, we are forced to respect the drawdown in progress. This drawdown has increased potential to elevate market volatility and find the S&P 500 achieving the 200-DMA near-term.
What we are also forced to suggest, before delving into the technical probabilities near-term, is that the President's tweets don't necessarily care about technicals. As such, what we are considering over the weekend may turn out very differently come Monday. The bullish technicals recognized by a unique MACD crossover have been completely negated by geopolitical issues surrounding trade. As such, while we analyze the technicals we offer this caveat as it relates to the general trends.
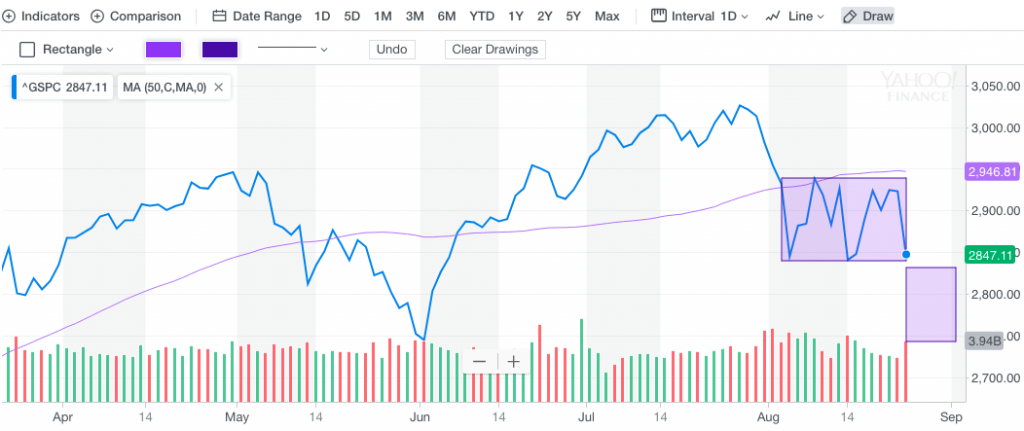
The S&P 500 chart above offers another view of what may prove a breakdown to the 200-DMA, which resides at 2,802 presently. The box pattern for the benchmark index charts the upper bound test, at and around the 50-DMA, several times and then retreats to the lower bound now 3 times. Historically, when the lower bound level is achieved a 3rd time, it tends to break out of the box to the downside. This usually occurs with elevated volatility and protection buying. The second, small box represents the area below the 200-DMA with it's lowest level at the June lows in the 2,740s. This is not necessarily a forecast, but a probability to consider. Again, tweets don't care about technicals.
In analyzing the S&P 500 technicals we look at a few key factors. First is resistance or levels that an index or stock may struggle to rise above. The S&P 500 ran right into its 50-DMA near 2,940 a couple of times now. As for support, or levels at which buyers are more likely to come back into the market, there are 3 key levels to consider:
- 2,822. The intraday low from August 5th is only about 1% below Friday's close.
- 200-day moving average. Currently, at 2,802, the 200-day moving average is a closely watched trend indicator that is commonly viewed as either support or resistance, depending on where the index sits in relation to it.
- 2,740. Perhaps the strongest level of support for the S&P 500 is 2,740. This key level has been tested 2 times so far this year, but it failed to close below that level either time. 2,740 also happens to be 9.5% below the July highs, right in line with a standard 10% correction.
Given the technical setup presently that is coupled with more pressing geopolitical impacts on the macro-outlook, I encourage investors who are inclined to actively manage positions to consider raising cash and/or introduce hedges to your portfolio. The reasons for protecting one's portfolio given the technical setup presently are numerous, but I can limit them to the more notable bullet points as follows and offered by Marc Chandler in part:
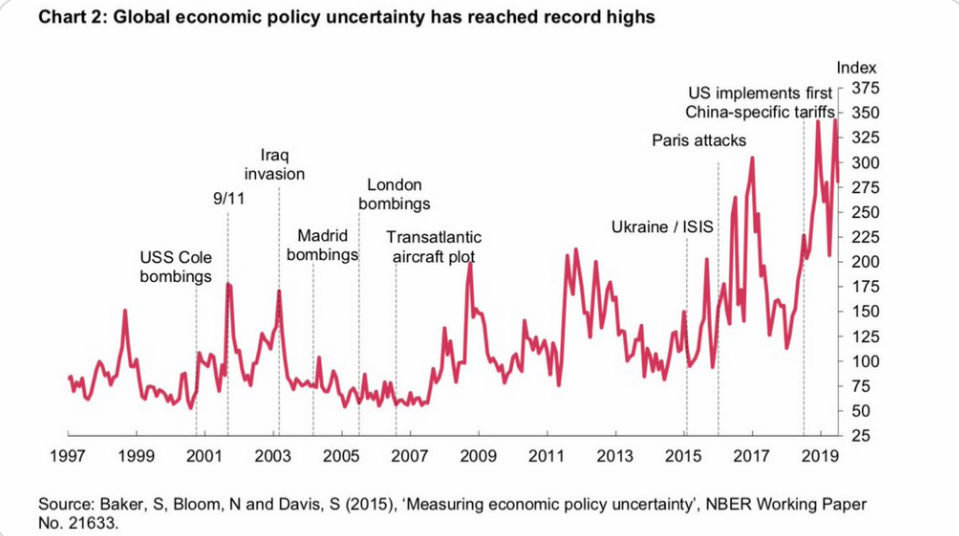
- Data from the first half no longer matters in terms of policy and even July data will have little impact. How much do investors despise the ongoing trade feud, see chart below:
- Before the central banks meet again, they will have a sense of how August is faring.
- The market is forward-looking and has to price in not only the 15% increase on $300 billion of Chinese goods that had not been included in earlier actions but the risk of a further increase. The market is forward-looking and aims to discount first and for the worst-case scenario.
- The coming weeks have all the makings of the summer doldrums.
- Algorithms are level seeking and after several weeks of failing to recapture the 50-DMA, the presumption is that the 200-DMA is likely more achievable.
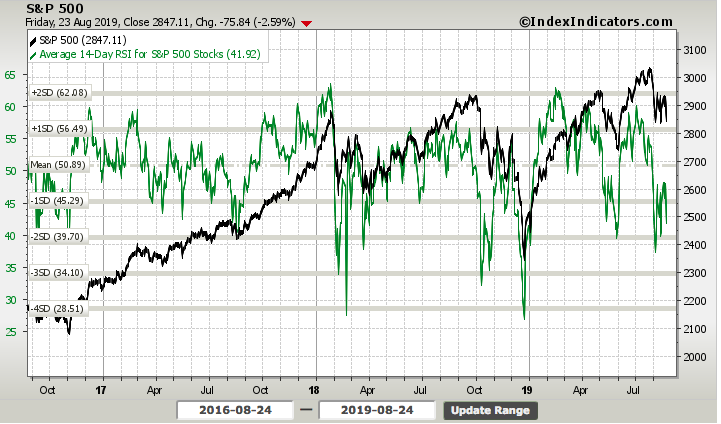
Moreover, while the end-of-week market action was painful for many, the S&P 500 14-day RSI (Relative Strength Index) has also not even dropped to its early August lows. The RSI finished the week just below 42. There may still need to be some flushing out of positions before a truer bottom can be found, whereby the impact of tariffs and there assumed affect on EPS is rationalized as "fair value" or a balanced risk/reward.
Unfortunately and as we approach the final month of the Q3 period, the major stock indices have made no progress over the last 12-month period. Dividends have helped slightly though. While everyone is saying that the S&P 500 hasn't gone up for the past 1.5 years we would also invite investors to consider the flip side of that argument. Despite all this trade war, and earnings slowdown rhetoric, stocks haven't been able to fall and stay down. Of course, this is partly due to the record level of buybacks during the period. This is why shorting stocks from a long term perspective is hard. And then there's the dividends, right? This is the broader picture we hope investors realize when we suggest that the current pullback that may become a downtrend if a 10% (correction) retracement occurs, is still yet an opportunity. But what creates opportunity is having cash/dry powder to buy those stocks and/or ETFs on your shopping list.
We know that the technicals are pointing to the greater probability of further downside, but with earnings still growing in spite of all this trade war escalation, we may not see much more than a 10% total correction from peak to trough, if "the dust doesn't settle" sooner. This was not our base case a month ago, but it is impossible to forecast escalating trade war rhetoric of this magnitude. With that being said, when we review the CBOE Equity put/call ratio, it suggests a bottoming process is afoot. That bottoming process, however, could last several weeks and demands a reversal catalyst. That may be where the central bank meetings come into focus, to provide such a catalyst should cooler heads not prevail on the trade front.

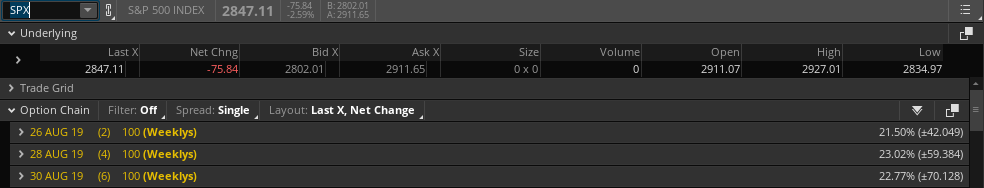
The S&P 500 has exceeded its expected move in 4 of the last 5 weeks. The weekly expected move for the past week was $58/points. With the late week sell-off and spike in implied volatility (VIX), the weekly expected move for the coming week is now a whopping $70/points.
The VIX, which had fallen below 16 intra-week, rose nearly 20% Friday alone. There was a good deal of short interest building in VIX futures to coincide with the belief that the S&P 500 was imminently going to break above its 50-DMA. Since then, we've seen some unwinding of those short VIX futures positions according to the latest COT report.

This is yet another signal or indicator that investors/traders/CTAs are likely preparing for more volatility near-term.
"Positive trade news will give Wall Street investors more confidence about the market, but “there’s more room to fall” without progress, Wharton School’s Jeremy Siegel said Friday.
The VIX sprang nearly 20% to about 20 points during the trading day. We’ve seen it at 30 and 35 under uncertain conditions. That means “there is some hedging going on, but really not as much as there could be given uncertainty.”
Trade Wars
Nobody wins in a trade war; nobody as they are not for the winning but for the suffering until it ends. That is where the global economy is presently, suffering through a multi-continent trade war. The latest tit-for-tat escalation identifies two main concerns with regards to the U.S./China trade war.
- President Donald Trump did not honor the trade truce initiated at the G-20 Summit, between China and the U.S and for reasons we can justify or negate.
- The most recent escalation of tariffs to be imposed starting September 1st will hit upon consumers.
With regards to the newly announced retaliatory tariffs from China, aimed at U.S. exports to the region, here is the list of goods China is targeting as depicted in the chart below.
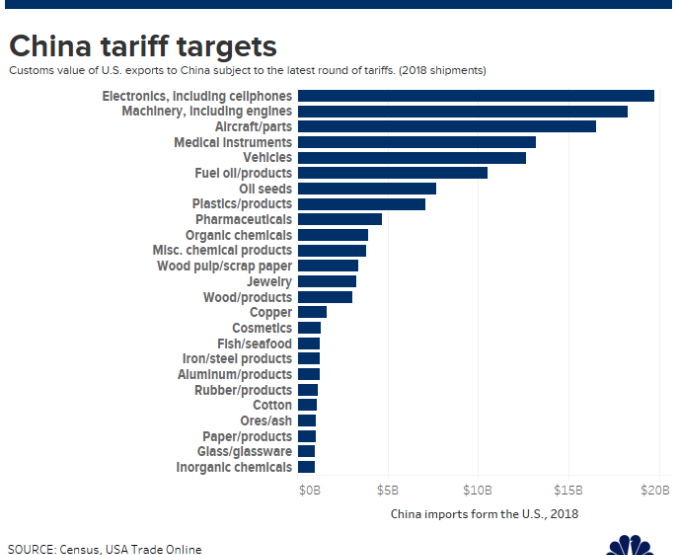
The Chinese State Council said it decided to impose the tariffs of either 5% to 10% on either Sept. 1 or Dec. 15. China also added a 25% tariff on U.S. cars and a 5%tariff on auto parts and components, which will go into effect Dec.15. Electronics, including cellphones and chips, is the category with the biggest value of American imports into China.

Now with regards to the tit-for-tat tariff escalations, we can understand their impact on the global economy, as they have been felt for the better part of the last 12 months. With respect to the ORDERS barked through the President's Twitter account, those are the ones that carry the greatest uncertainty. One could actually suggest that absent those ORDERS, the market may have not responded so violently as it did on Friday.
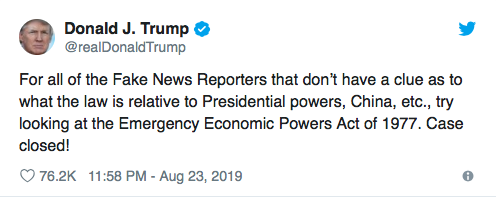
The question as to whether Donald Trump has the authority to ORDER U.S. companies to leave China is somewhat subjective but demands many steps and comes with many nuances. The IEEP Act of 1977 gives him "certain" authorities, but they are mainly with respect to future activity, not past or present activity.
Trump does not have the authority to “duly order” companies to leave China, according to Jennifer Hillman, a Georgetown University law professor and trade expert at the Council on Foreign Relations.
But under the law he cited, Trump can prevent future transfers of funds to China, she said. First, he would have to make "a lawful declaration that a national emergency exists,” she said. Congress could terminate the declaration if it wishes, she said.
“Moreover, even if all this happened, it would not provide authority over all of the U.S. investments that have already been made in China,” Hillman said.
"IEEPA is not without limit," said Rod Hunter, an international-trade lawyer at Baker McKenzie, who was senior director for international economics at the National Security Council during the George W. Bush administration. "If Trump used it to destroy the existing property rights of U.S. persons, you can be certain there will be constitutional and statutory legal challenges."
Economic models seem to see the impact of trade conflict to be twice as much in China as it is on the United States. The tariffs and counter-tariffs are thought to shave Chinese GDP by 0.4%-0.5% and the U.S. by 0.2%-0.25 percent. The new actions could nearly double the impact and have a compounding affect should consumer sentiment dive if companies attempt to pass the price hikes along to consumers.
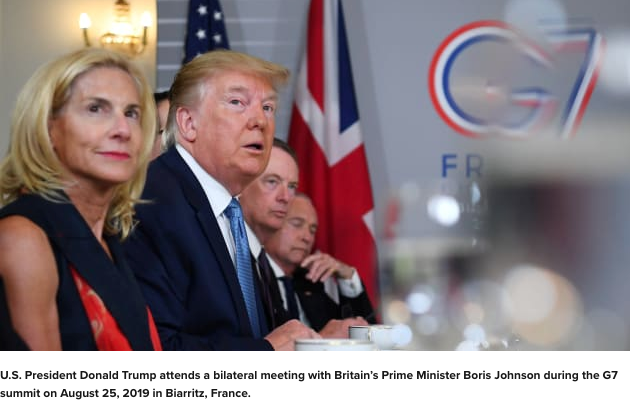
As the media continues to follow Trump's every tweet and travels to the G7 summit this weekend, recent reports have offered a more docile and pragmatic President Donald Trump.
“I could declare a national emergency, I think when they steal and take out and intellectual property theft anywhere from $300 billion to $500 billion a year and when we have a total lost of almost a trillion dollars a year for many years,” Trump said, adding that he had no plan right now to call for a national emergency.
“Actually we are getting along very well with China right now, we are talking. I think they want to make a deal much more than I do. I’m getting a lot of money in tariffs its coming in by the billions. We’ve never gotten 10 cents from China, so we will see what happens.”
When asked if Trump had second thoughts about Friday’s move to escalate the trade war with China, Trump said “Yup.” “I have second thoughts about everything,” he added. In the meantime and with both countries hurling tariffs at each other, China has vowed not to back down to the U.S. President's bullying tactics, as they deem them to be.
China on Saturday said it would continue fighting the trade war with the US “until the end” after the two sides slapped further tariffs on each other’s goods.
The commerce ministry issued a statement calling on Washington not to “misjudge the situation and underestimate the determination of Chinese people” after U.S. President Donald Trump announced new tariffs on Chinese imports. “The U.S. should immediately stop its wrong action, or it will have to bear all consequences. China’s will to defend the core interests of the country and the fundamental interests of the people is indestructible, and will not fear any challenge.”
In the past, the President has caved to market pressure, just like most White House Administrations have done in the past and through policies. Should the markets continue to deteriorate, I would anticipate a similar response from the current Administration that would ease market anxieties and selling pressure. Despite the Trump bravado, it is already clear that as the market goes, he goes and in recent weeks and days he has even been found to worry about the state of the economy.
Feeding Trump’s anxiety, aides say, is his realization that the economy is undeniably wobbly and something he needs in his corner for re-election in 2020. Trump planned to question leaders about what can be done to reignite growth in the U.S. and abroad, as well as to open European, Japanese and Canadian markets to American manufacturers and producers. Trump has imposed or threatened to impose tariffs on all three markets in his pursuit of free, fair and reciprocal trade. How's that working out?
What Can The Fed Do?
There's not a whole lot the Fed can do about curbing the effects from a trade war. One of the many advantages of the global trading system supported by the U.S. until now was that rich-country central bankers did not have to think about trade. Welcome to the new reality, for better or worse. Here are some detailed thoughts about trade and the Fed from Adam Posen, president of the Peterson Institute for International Economics and who was a monetary policy maker at the Bank of England.

"We have no history of trade wars to draw on since the 1930s, and we took the system for granted. As a result, our forecasting models are biased toward underestimating the harms they do.
American and European investors kept assuming that President Donald Trump was being aggressive just for negotiating posture and, like with the U.S. debt ceiling, would fold his position if the stock markets fell too much.
This was profoundly mistaken, so I warned in May that a wake-up call was due when Trump's ideological hostility to trade and to China became undeniable; when foreign governments decided that there was no point in negotiating with him; and when the escalation of conflict went beyond U.S. control.
The combination of the budget deal which delivers nearly half a per cent of GDP more government spending in 2020 than expected and the Fed's rate cut looked like plenty of policy insurance to forestall a recession.
But with his increase in tariffs on Chinese goods announced in early August and his threats of currency war, Trump managed to leapfrog even my pessimistic forecast about conflict escalation. Between the substantial damage that Trump has created and the fixed-income market panic, we now have a very high chance of a U.S. and thus probably global recession, more likely than not in coming months."
There in lay the problem as it pertains to the Fed! There is no playbook for a trade war, there's never been an interconnected global economy of this size and scale that is so dependent on its fluidity and structure. Fed Chairman Powell said as much in his prepared remarks at Jackson Hole on Friday.

“While monetary policy is a powerful tool that works to support consumer spending, business investment, and public confidence, it cannot provide a settled rulebook for international trade,” he said in prepared remarks. “We can, however, try to look through what may be passing events, focus on how trade developments are affecting the outlook, and adjust policy to promote our objectives.”
Beyond this reality, the Fed has sustained its previous comments that it will act as appropriate to sustain the economic expansion. Powell did say the Fed is looking at ways to address developments in a landscape that has changed significantly since the expansion began a decade ago.
"Moreover, while monetary policy is a powerful tool that works to support consumer spending, business investment, and public confidence, it cannot provide a settled rulebook for international trade. We can, however, try to look through what may be passing events, focus on how trade developments are affecting the outlook, and adjust policy to promote our objectives.
We are examining the monetary policy tools we have used both in calm times and in crisis, and we are asking whether we should expand our toolkit."
The calendar set up for the market is rough over the next couple of weeks... and why? The Fed is almost certain to cut rates by at least 25 bps come to the next policy meeting on September 18, 2019.
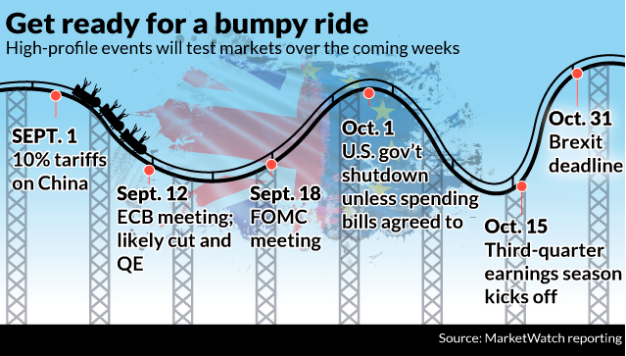
There's a lot of dead policy time between now and central bank policy meetings and as such, the markets may be left to a period of uncertainty. Markets hate above all else, uncertainty!
With the yield curve inverting, almost all bonds yielding far below the Fed Fund Rate (FFR), failure to achieve the price stability mandate for the last 7 years, a global growth slowdown with recessionary conditions now presented in Germany, the uncertainty of a protracted and escalating trade war, there is ample cover for the FOMC to cut rates in September.
The Fed is behind the curve already, but it has the means to catch up with a 50 bps rate cut in September. The risk remains that it only takes another 25 bps out of the FFR and fails to ease financial and economic conditions for the better. Given the additional pressure from the President, which is also seen as a tit-for-tat response hurled at the Fed from the President, we are of the opinion the Fed recognizes this after Friday's tweets.
Economic Data
Last week's economic data, by and large, proved the continued divergence between the manufacturing economy and the broader consumer-based economy. The August flash Markit PMI composite was weak as the manufacturing sector fell into contractionary territory. Specifically, the composite PMI fell to 50.9 from 52.6 which is a 3 month low. The services PMI fell from 53 to 50.9 which was a 3 month low as well. In July it seemed like the service sector was vastly outperforming manufacturing, but in this reading, the gap closed significantly.
The manufacturing PMI fell from 50.4 to 49.9 which was a 119 month low. Much was made about the fact that it fell below 50, but the sequential decline wasn’t terrible. We already knew manufacturing was contracting because it fell 0.5% yearly in the July industrial production report. The PMI can still be above 50 if the 2nd half of the month shows a very slight improvement from the flash reading. The real story from this report is the weakness in services. The manufacturing output index actually improved as it went from 50.5 to 50.6 which is a 2 month high.
We won't get the ISM Manufacturing data for a couple of weeks, but with the G7 Summit underway, the global economy comes back into focus as almost every G7 country's PMI is in contraction territory.

Elsewhere in the domestic economic data, housing proved a bright spot last week with Existing Home sales beating economists' forecast. Existing home sales were up 0.6% year-over-year (YoY) in July. This was the first YoY increase since early 2018. Inventory is still low, and was down 1.6% year-over-year (YoY) in July.
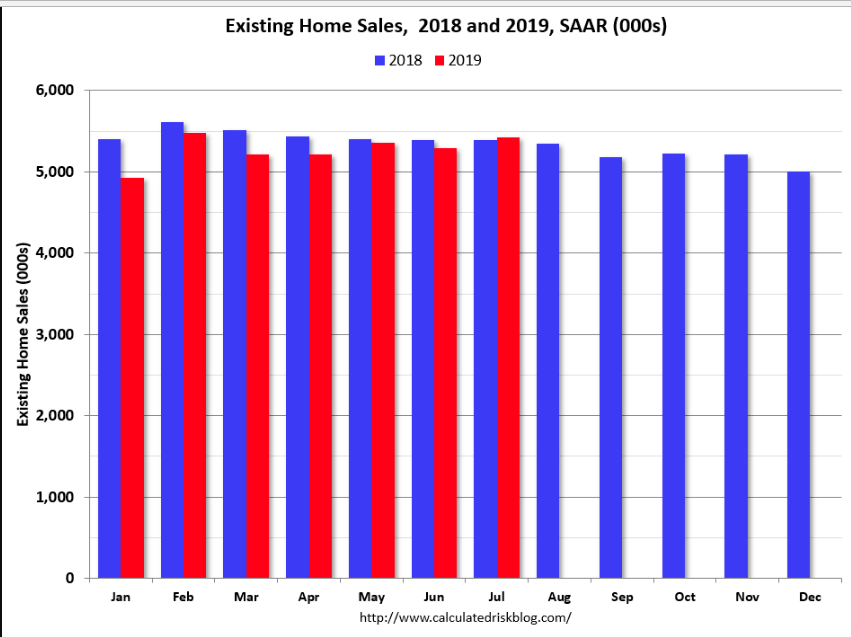
In addition to a strong Existing Home sales report, New Home sales had hit a new cyclical high in June, given the upward revision. Sales of new single‐family houses in July 2019 were at a seasonally adjusted annual rate of 635,000, according to estimates released jointly today by the U.S. Census Bureau and the Department of Housing and Urban Development. This is 12.8% below the revised June rate of 728,000 but is 4.3% above the July 2018 estimate of 609,000.

Alongside a drop in Initial Jobless claims of 12,000 and Leading Economic Indicators hitting a record level for the expansion cycle, the economic data was largely positive for the week. Having said that, the data remains backward-looking and some of the forward-looking data remains mixed and prone to economic exogenous shocks, such as tariffs. For the week ahead, here is a look at the economic calendar:
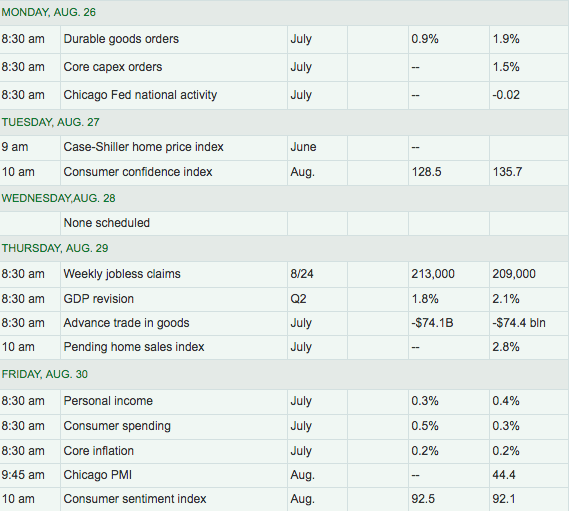
Some of the more important data to be released this coming week will be Durable Goods Orders, which had a nice bounce-back last month, but also came with a sharp downward revision to the May report. Consumer Confidence will also be monitored after accelerating higher in the last reading, but also after seeing some of the latest preliminary University of Michigan Sentiment data pointing lower. With the "Markets In Turmoil" and tariff headlines abound, the consumer may be found in need of greater confidence sooner rather than later. The July read on PCE will also play a bigger role this coming Friday, as it is the most heavily watched gauge of inflation in the economy by the FOMC. If all this wasn't enough, China's PMI data is also due out this week, which if weak, will further weaken global equity markets and find bond yields likely heading lower.
Midweek, investors will also get a second look at Q2 GDP, which is expected to tick lower from the 2.1% initially reported. Looking ahead to Q3 GDP, most firms and regional Federal Reserve banks are forecasting 2% or better GDP for the period. The Atlanta Fed GDPNow forecast is currently at 2.2% and will be revised after Monday's release of Durable Goods orders data.

Earnings Outlook
One of the more pressing problems with managing money today is that markets are now trading on “tweets" and “headlines", more than fundamentals. This makes being either long or short, particularly difficult. But that is also why we rely on the earnings picture, to give us a longer-term perspective.
The good news is that for all of the earnings recession calls that came with Q1 and Q2 earnings seasons, none have come to fruition. Based on the latest data from Refinitiv, it looks as though Q2 earnings grew just over 3% on a YoY basis.
Aggregate Estimates and Revisions
- Second-quarter earnings are expected to increase 3.2% from 18Q2. Excluding the energy sector, the earnings growth estimate is 3.9%.
- Of the 482 companies in the S&P 500 that have reported earnings to date for 19Q2, 73.9% have reported earnings above analyst expectations. This compares to a long-term average of 65% and prior four-quarter average of 76%.
- 19Q2 revenue is expected to increase 4.7% from 18Q2. Excluding the energy sector, the growth estimate is 5.1%.
- 57.1% of companies have reported 19Q2 revenue above analyst expectations. This compares to a long-term average of 60% and an average over the past four quarters of 63%.
- For 19Q3, there have been 63 negative EPS preannouncements issued by S&P 500 corporations compared to 26 positive, which results in an N/P ratio of 2.4 for the S&P 500 Index.
- The forward four-quarter (19Q3 –20Q2) P/E ratio for the S&P 500 is 16.8.
- During the week of August. 26, 14 S&P 500 companies are expected to report quarterly earnings.

Investor Takeaways
The week ahead may simply be characterized as an in-between period, whereby investors are taxed with the responsibility of voting. And how do investors vote, with their assets/holdings. I believe the coming week will prove another net negative week in the equity markets unless there proves a substantial relaxation in the already escalated trade war.
Investors voted with their wallets before the weekend in the same way they responded to the tweet that ended of the second tariff truce to start the month. Over the past few months, I have reiterated the importance of holding higher levels of cash and trading nimbly. Yes, the yield curve has inverted periodically over the last 2 weeks and remains extremely flat, but yes this time is different as central bank easing policies have interfered with the long-end of the yield curve. Nonetheless, recession talks still surround the yield curve inversion. But even so, Goldman Sachs data suggests that hedge funds are not positioned for a recession.
The bank studied the holdings of 835 hedge funds with $2.1 trillion of gross equity positions at the start of July and found that overall these funds are overweight cyclical sectors, favoring stocks in Information technology, consumer discretionary, industrial and materials sectors relative to the Russell 3000 index.

Meanwhile, hedge fund managers were underweight stocks in sectors typically seen as defensive, like real estate, consumer staples, and utilities. They were, however, overweight the health care sector, also seen as defensive, as they took advantage of the market’s fears of Medicare-for-all and other legislation being debated in the Democratic presidential primary contest, according to Ben Snider, equity strategist at Goldman.
“Hedge fund leverage remained constrained in most of the first half of 2019,” Snider wrote, “but funds lifted exposures sharply in late June and July as the Fed began to cut interest rates and headlines indicated improving US-China trade relations.”

The fact is that we are not presently in a recession and we remain within the onset of a Fed easing cycle. Taken together, good things tend to occur in the stock market in the future, as historically depicted in the table below of like conditions. With that being said, we have to recognize the uniqueness of the current cycle. It was made abundantly clear that the Fed's ability to thwart the tariff regime is muted after the Jackson Hole opening remarks proved enough to offset the China retaliatory tariffs, but not President Trump's tweets of additional tariffs.
We are still at a point where policy changes can have a big impact. Most will find it difficult to chase a rebound. This is exactly the reason why I have emphasized volatility, strategic planning and being prepared for these wild swings. With policy decisions the most important market issue in 2019, we must know what might constitute good news and what may purport itself as bad news.
The LEI has yet to turn negative this cycle. The index has fallen negative YoY before all nine recessions since 1955.
“Some investors have pointed out slowing LEI growth as a reason for caution,” said LPL Financial Chief Investment Strategist John Lynch. “However, the LEI is signaling moderate U.S. economic growth ahead, with no signs of an imminent recession.”
From a technical perspective, the market is back in oversold territory as mentioned earlier, so a bounce next week is possible, but this is still a sellable rally without positive headlines. Regardless of valuation, defensive stocks do best in exactly this type of environment. This is an environment where typically, healthcare, utilities, consumer staples and real estate outperform.
Understandably, this is the opposite of where Goldman Sachs recent data sees hedge funds positioned, but hedge funds typically underperform the market as well.


