
Total Value Of Trade Between U.S. And China Begins Shrinking
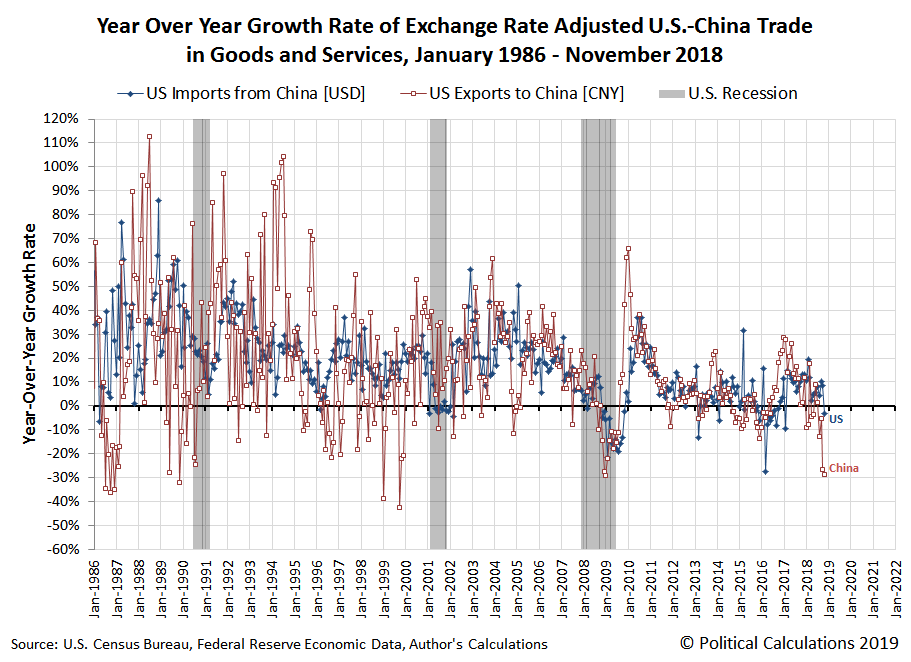
In November 2018, the year-over-year growth rate of the value of goods imported by the U.S. from China dropped into negative territory.
That observation comes from our analysis of the U.S. Census Bureau's report on the U.S.' trade in goods with China, which had been delayed for over a month due to the partial U.S. government shut down. It marks the first month since the U.S.-China trade war began on 22 March 2018 where we can point to a month where the total value of goods that the U.S. imported from China dropped below the value reported a year earlier, where the U.S. had largely been able to avoid following China's fate in that respect. Until November 2018.
The following chart shows that development and also reveals that the year-over-year growth rate of the value of U.S. exports to China became more negative in November 2018. That outcome largely occurred as a consequence of China's retaliatory tariffs on U.S.-produced soybeans, which has prompted China's soybean buyers to effectively boycott the 2018 U.S. crop (until they began making some relatively small buys in December 2018).
Taking a step back to look at the combined value of goods and services directly traded between the U.S. and China, we find the size of the gap between where that level of trade is today with respect to where it would likely be in the absence of the trade war between the two nations opened up in November 2018, increasing by over 50% from $1.6 billion in the previous month to $2.5 billion.

In percentage terms, November 2018's level of direct trade between the two nations is a little over 4% below where we estimate it might otherwise be based on the pre-trade war trend for this data.
References
Board of Governors of the Federal Reserve System. China / U.S. Foreign Exchange Rate. G.5 Foreign Exchange Rates. Accessed 7 February 2019.
U.S. Census Bureau. Trade in Goods with China. Accessed 7 February 2019.
U.S. Census Bureau. U.S. Trade Online. Accessed 7 February 2019.
Disclaimer: Materials that are published by Political Calculations can provide visitors with free information and insights regarding the incentives created by the laws and policies described. ...
more

