
Timing The Tantrum: The Market Implications Of A Big Treasury Sell-Off
Written by Chris Turner, James Knightley, Padhraic Garvey, Antoine Bouvet, Jeroen van den Broek, Timothy Rahill, Warren Patterson, Petr Krpata, Trieu Pham and Egor Fedorov
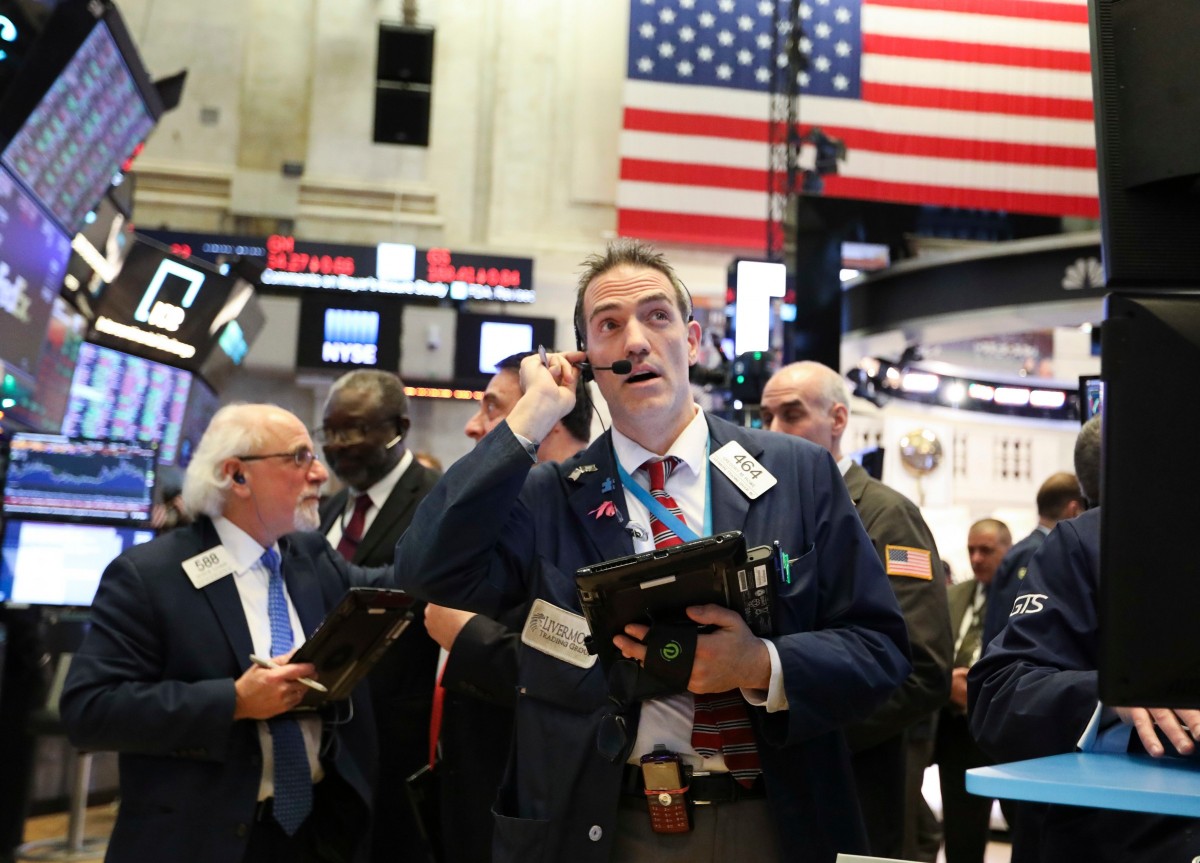
Growing confidence in the global recovery, especially in the US, is leading to speculation over when the Fed might take its foot off the accelerator and buy fewer Treasuries and Agencies. Increasingly, parallels are being drawn to similar events in 2013. In this Q&A we look at when such a sharp bond sell-off might occur and its cross-market implications.
Memories of 2013
Investors are increasingly confident of a ‘V’ shape global recovery, so much so that the emerging concern is not growth, but inflation. This has seen the long end of bond markets come under pressure, refreshing memories of 2013. This was the year the Fed exacerbated the bond market sell-off by discussing the reduction or ‘tapering’ of its US Treasury debt purchases.
At the time, a sharp rise in US yields rippled through asset classes around the world, hitting equities and commodities (two heavily backed markets in 2021), widening credit spreads, and lifting the dollar.
So, we thought it would be useful to look at just when the Fed might be forced to discuss tapering this year, the likelihood of a tantrum in the US Treasury markets, and how asset markets would react were such a tantrum - let’s call it a quick 50bp rise in US 10 year Treasury yields - to be seen.
Cross-market reaction: How asset markets performed during the 2013 taper tantrum
(Click on image to enlarge)
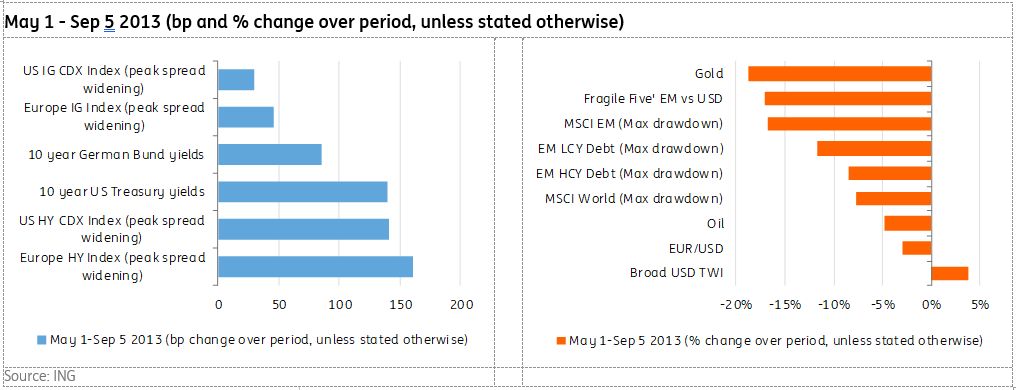
ING, Refinitiv
When could the Fed start to communicate a taper?
At tomorrow’s testimony to Congress, Jerome Powell will again insist that the Fed are not contemplating any imminent shift in their policy and stick with the “guidance” that they will continue to buy $80bn of Treasuries and $40bn of MBS per month “until substantial further progress has been made toward the Committee's maximum employment and price stability goals”.
But what is “substantial further progress”?
It will probably be at the point where we have a clear view that herd immunity is being reached, a re-opening is happening and price pressures are becoming apparent. All three could happen in the mid to late second quarter.
On vaccination & herd immunity: President Biden's Chief Medical Advisor, Anthony Fauci, suggests he thinks herd immunity is 85%-90% of Americans being vaccinated. At the current run rate of 1.6 million doses a day that puts us at herd immunity in mid-January 2022. However, more money and better management mean Biden is targeting a speedier program. There is no reason to think the US can’t quickly hit 3-million (1% of its population a day) and if it can do that we get herd immunity in the States by July 2021. And should the Johnson and Johnson vaccine be approved, which only requires one dose, this would bring it forward into the second quarter.
On re-opening: It is neither Fauci nor Biden's call but individual state governors. For them, the electoral cycle may mean reopening before herd immunity is reached. Think 'jobs, jobs, jobs', especially if hospitalisation numbers have fallen away dramatically as we hope they should over the next two to four months.
On the economic bounce-back: Household savings levels have increased $2.4tn since 3Q 2019 – that is just money in the form of cash, checking, and savings accounts – while credit card balances are at 4-year lows. Wealth gains are also felt more evenly across the income spectrum than in Europe given the stimulus cheques while expanded and uprated unemployment benefits have seen a majority of lower-income households gain income relative to before the pandemic.
Contributions to changes in US personal income levels versus Feb 2020 (annualised $trn)
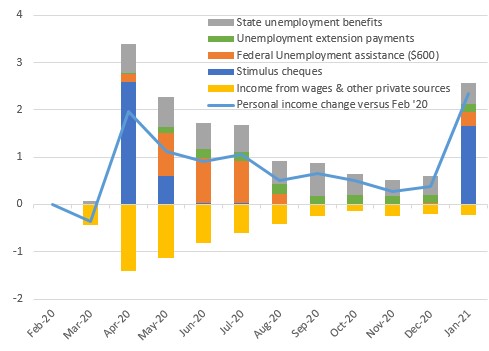
Macrobond, ING
Throw in another $1.9tn fiscal stimulus, a wave of corporate CAPEX, and a housing construction boom and you have the recipe for very strong economic activity as soon as the doors are unlocked – hence our 5.5% GDP forecast for this year risks being on the low side.
On inflation: Even if we get just “benign” or “typical” 0.2%MoM readings through the rest of the year, headline inflation will rise to 3.1% by May. With rising freight costs, fuel costs, commodity prices, and unit labour costs this could be even higher, possibly in a 3.5-4% range. The key question is how sustainable inflation will be? Ordinarily, we would look at wages as the US is a service sector and labour costs are the biggest input. But with nearly ten million fewer people in jobs than a year ago, there is unlikely to be much wage pressure in the near-term. That said, vigorous demand coming up against supply constraints within many industries (bars and restaurants having gone out of business, airlines mothballing aircraft, a lack of upkeep in entertainment venues and hotels etc) could boost corporate pricing power and make inflation sticky.
On the Fed: By the third quarter we could see real pressure on the US Federal Reserve to justify what it's doing. 3.5% inflation, booming growth and a waning pandemic would, one would think, be compatible with “substantial further progress” – progress implies a journey, rather than an end result. Consequently, we think the Fed will taper purchases in the fourth quarter, with some shift in communication presumably coming 2Q or early 3Q.
This suggests the June 16th FOMC meeting, where a new round of forecasts will be presented, could be the first time the Fed feels serious pressure to take its foot off the accelerator.
How would we define a bond market tantrum and how likely is it?
Anyone with very young kids will understand that a tantrum needs to be left alone to take its course. Once it starts, just let it happen, as attempting to end it early will only prolong it, or make it worse, or both. The trick then is to avoid the tantrum in the first place. But as every good parent knows, taking away the cookie jar must be done at times, tantrum or not.
At some point, the Federal Reserve will have to taper. Remember, as the Fed tapers, policy is still exceptionally easy, as the Fed is still buying billions of dollars of bonds per month, just less than the previous month, and less again in subsequent months.
But the bond market won’t care about that. What the bond market sees is a progression towards a point where the Fed is no longer buying bonds, and beyond that to a point where the Fed will hike rates. As rates rise, the present value of fixed coupon and redemption payments fall. New bonds need to come with larger coupons, and older bonds trade at a deeper discount to par – code for (likely) large negative total returns.
The faster this happens, the worse is the mood of the bond market and the more intense is the tantrum; the so-called taper tantrum.
In 2013, the size of that tantrum was 150bp, as the 10yr rose from 1.5% to 3% over the course of 5 months. Turning to the current US 10yr yield - the move from the low at 50bp to just under 1% was mostly a recovery from extremes. The subsequent break above 1% was an acknowledgement of reflation, and now we are at above 1.25%. Our end-year target is 1.75%, and along the way, there could well be a tantrum-style push. A 50bp rise in any single month would certainly be a tantrum.
Such a push could come from discomfort on inflation. The issue here for bond investors is the erosion of the real value of future coupon and principal payments that inflation implies. But remember, if the Fed does nothing into an inflation spurt, namely not bringing forward tapering, then bonds become even less protected from inflation, as it is effectively allowed to rip higher, eroding future fixed payments in real terms even further.
A taper need not result in an outsized tantrum
This is an important nuance. A taper need not result in an outsized tantrum if it is seen as the Fed taking action to reduce the inflation risk. The tantrum would be more an inflation tantrum than a tapering one. And if the Fed chooses to “twist” the QE by reducing the size done while risk-weight-lengthening the maturity of purchases, the impact of tapering could be considerably lessened.
Either way, we likely end up with higher yields. The only uncertainty is how high. Our end-2021 target of 1.75% is in fact consistent with at least some version of tapering in anticipation of rate hikes to come (much) further down the pipe. A more extreme version of events is one where our 1.75% target gets brought forward by 3-6 months to mid-2021, and the bond market extrapolates more of the same in H2, targeting a break above 2%, and beyond. Something like a cumulative 75-100bp uplift from where we are currently in the space of a few months would smell and feel very much like 2013.
Now that is the one that risk assets really have to worry about; a not improbable risk case scenario that sees the 10yr break above 2% as a theme, not far enough out to be a fuzzy 2022/23 forecast, but in 2021 and very much with a crystal clear focus.
European Rates: How far would they get dragged?
By and large, most of the drivers for the US reflation trade, aggressive fiscal policy, and new dovish central bank goals, are absent in Europe. This did not prevent European rates from reacting in kind with higher rates, greater inflation expectations, and steeper curves. This is because capital markets are more correlated than the real economy. Higher rates in the US might convince foreign investors to allocate more money there, and borrowers to borrow in EUR or GBP instead.
There is also a growing risk of the reflation trade becoming a duration event
There is also a growing risk of the reflation trade becoming a ‘duration event’ where the rise in rates feeds on itself. The structure of financial markets is different from one country to the next, but they share some characteristics: Investors seeing rates rise will look to reduce duration, pension managers will tend to reduce rates hedges, large rates portfolio will see their duration, and hedging needs, diminish as rates rise.
The upshot is, brace yourselves for higher EUR and GBP rates in case of a taper tantrum in the US, only to a lesser extent. We would struggle to justify 10Y EUR swaps rising above 0.2% unless the Fed loses control of the USD curve, but a further steepening of EUR 10s30s could continue to bear the brunt of the adjustment, rising back to 60bp. The GBP market has been even more impacted by the prospect of reflation, courtesy to a faster vaccine rollout and a central bank perceived to be more hawkish. 10Y swaps rising to 1%, from 0.80% currently, is a distinct possibility in the coming months, higher than this would sow the seeds of a sharp retracement lower.
Equities: What size correction could we see?
Investors have started the year with a conviction call on a ‘V’ shaped recovery meaning that overweight positioning in equities and commodities is at a decade high. Clearly, a sharp rise in US Treasury yields increases the discount rate used in equity valuation models and, as the European Central Bank puts it, would trigger a ‘more broad-based repricing’ of risk assets.
Global equity investors appear to be running very overweight positions
The experience of 2013, triggering a maximum drawdown of 7.5% in the S&P 500 – largely seen at the most intense period of the yield rise in late June – could well be seen again. And as our earlier chart shows, EM equity indices could well see maximum drawdowns of around 15%. This especially so given that global equity investors appear to be running very overweight positions in EM equities right now. Recall that Asian equity markets, China, Taiwan, Korea, India have some of the largest weights in global EM equity benchmarks and could be in the front-line of the adjustment.
But recall as well, summer 2013 proved barely a blip in the long-term equity bull-market and there is no reason to think that any bond tantrum-induced equity correction this summer would be more than that, just a correction.
Credit: Can positive net supply trends limit the fall-out on the IG and HY market?
The technical picture remains very positive for credit in 2021 which will keep any major sell-off muted. High yield should underperform, particularly as the pool of leverage continues to grow. The rise in rates will mean higher funding levels, and in combination with the spread widening, funding costs will increase. This will be particularly worse for high yield. However, less supply is expected for 2021 vs 2020 in both EUR and USD meaning that net supply will be down at a period of rising yields. Thus net supply trends will offer some support for the credit markets.
We expect to see a more muted spread reaction in Euro compared to USD. This is due to the lack of direct central bank support in USD (compared to CSPP in Europe) and a significantly stronger EUR technical picture.
The technical picture remains very positive for credit in 2021
ECB activity in CSPP has and will continue to be substantial, keeping spreads supported and primary markets open for refinancing. Back in 2018, CSPP purchases were falling off the edge while reinvestment levels were minimal. This time around reinvestment levels are significantly larger, meaning credit markets will remain supported for longer. That said, we do expect to see some small widening from current levels in Euro as tapering becomes a discussion and fundamental weakness starts to emerge.
Looking at synthetic credit indices, a sharp, 50bp adjustment in Treasury yields would, we expect, drive the CDX IG index higher by around 20-25bp landing around 70-75bp. CDX HY we would expect to widen more - widening 100bp-110bp to roughly 390bp-400bp. Euro synthetics would outperform against USD, but would likely still see a widening of 13bp-15bp for the iTraxx Main up to 55bp-60bp. Similarly, the crossover index would also see more severe widening by 60bp-80bp up to 300bp-320bp.
We have a conservative view in terms of our sector allocation. Higher beta and lower-rated names and sectors will be affected significantly worse by any tapering led sell-off. The Oil & Gas sector will likely underperform substantially, particularly as the supply expectations here are high, resulting in a net supply forecast of over US$100bn. Inflows over the past year have been favouring ESG 'green bonds' and we expect ESG debt and QE eligible debt to remain firmer.
Commodities – What would tapering mean for the complex?
The commodities complex has had a strong start to the year, in fact, the strongest start since 2008. Loose monetary policy, fiscal stimulus, and hopes of a strong post-Covid-19 recovery have boosted the demand outlook for commodities. Investors have been attracted to the complex as a result of growing inflation expectations.
Any tapering suggestion would put further pressure on gold
However, the rise that we have already seen in Treasury yields so far this year has put a fair amount of pressure on gold, with it increasing the opportunity cost of holding it. Any suggestion of tapering would likely put only further selling pressure on the yellow metal.
Gold will likely not be alone, there is an abundance of speculative money in commodities at the moment, and tapering should be enough to flush out a sizeable amount of these longs from most markets. This is particularly the case when looking at the metals and agriculture space, where the dollar value of speculative positions is at multiyear highs.
While we believe oil would also come under pressure, it is better placed in terms of its fundamental outlook. Expectations of a strong demand recovery over the course of the next year, along with OPEC+ supply policy should mean it is relatively better supported.
Foreign Exchange: Will we see a return of the ‘Fragile Five’?
It has become a consensus trade, but most, including ourselves, expect a benign dollar decline in 2021 as the world gets back on its feet and the Fed allows the US economy to run a little hotter than usual consistent with its new Average Inflation Target framework.
That view is reflecting in positioning data, where speculators remain quite short dollars and both commodity and EM currencies are heavily backed as the best vehicles to express the reflation trade.
The high yield and commodity complex would be hit most aggressively first
A sharp rise in US yields, enough to trigger an equity correction, would probably see the high yield and commodity complex hit most aggressively first. Indeed, this was the case in taper tantrum 2013.
However, compared to 2013, the valuations among the EM FX high yielders are currently less stretched (Fig 1) and the current account positions (Fig 2) have also improved over the years (especially in the case of Turkey). From this perspective, the scope for a meaningful sell-off among high-yielding EM FX should be lower than 2013 - i.e. far less than that witnessed by the Fragile Five (Brazil, India, Indonesia, Turkey, S. Africa) of roughly a 17-18% decline against the dollar.
Among the high yielders, perhaps the most vulnerable in EM might be the ZAR, which has enjoyed strong gains in 2021. And given that the bulk of portfolio flows into EM since November have largely gone into equity markets, particularly Asian equity markets, we would expect the CNY, TWD, and particularly the more volatile KRW to come under pressure. Also in this space, Indonesia’s current account deficit could leave the IDR exposed.
As positioning matters, the best performing EM currency during the 2013 taper tantrum (CZK) is unlikely to repeat the trend in our view and is in fact one of the most vulnerable EM currencies to a sharp spike in UST yields given the large one-way long positioning seen currently.
Positioning would also make a case for a further adjustment in EUR/USD, perhaps to the 1.17/18 area. But we would still consider this a correction rather than the start of a new trend, where a 2H global expansion would still favour cyclical currencies, including the EUR.
FX: EMFX looks better positioned today than in 2013 in terms of valuation and external imbalances
(Click on image to enlarge)
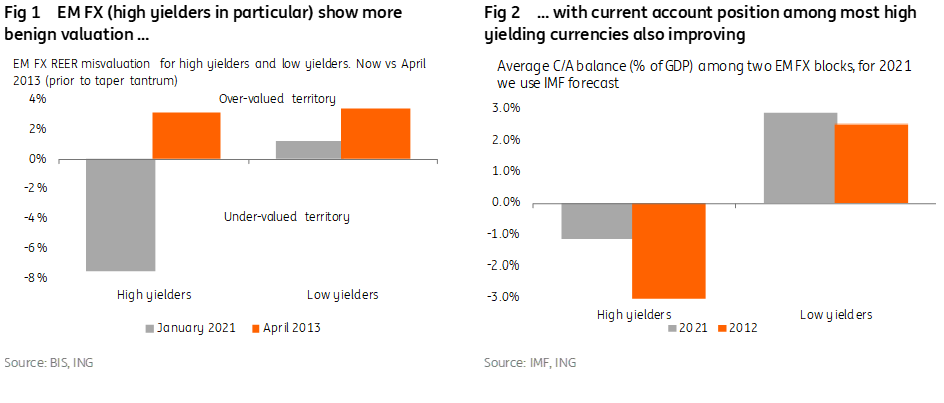
BIS, ING
EM Local Currency Debt: Less vulnerable than in 2013?
The EM local currency (LCY) bond market should follow a similar script to EM FX in terms of vulnerabilities to a tantrum, with high yielding bonds understandably more vulnerable than the low yielders.
While EM LCY debt levels are mostly higher than pre-2013, the fact that the sharp rise in debt in 2020 was a global trend should give EM countries some leeway. Many EM countries have also improved their fundamental positions compared to 2013. With the EM currencies looking more sound this should provide some cushion to local bond markets.
Within the CEEMEA space, we see POLGBs as the least vulnerable bond market. This because the NBP is engaged in QE and offshore positioning in the zloty and POLGBs is not overly stretched (with the currency benefiting from the current account surplus). The latter factor, in particular, should make POLGBs less vulnerable versus CZGBs (which were in the past considered the ‘quasi Bund’ of the CEE region), given the meaningful long positioning in both the koruna and offshore positions in CZGBs. Needless to say, the CNB is decisively more hawkish, moving CZGBs behind POLGBs in the order of preference.
Among the high yielders, we expect TURKGBs to do much better than in 2013 given the current greater resilience of the currency and less stretched positioning. We see SAGBs as most vulnerable, in line with the currency view. In terms of OFZ, the most solid fiscal position among the high-yielding CEEMEA bonds should provide some cushion, particularly if the rise in UST yields is accompanied by higher oil prices.
EM Hard Currency Credit: Can tight spreads withstand a tantrum?
US$-denominated EM sovereign credit has become sensitive to interest rate swings, with modified duration having risen to 8.9 years (up from 7.9 years in end-2019). Valuations are particularly stretched for investment-grade sovereigns (Z+109bp or a 2.34% yield based on Bloomberg Barclays Indices). Thus, assuming a gradual rise in UST yields and continuing portfolio inflows into EM debt, our baseline view assumes high yield sovereign credit remains attractive and is set to compress versus investment grade thanks to a higher spread buffer (Z+524bp or 6.3%).
However, there is a pain threshold: A too rapid rise in US Treasury yields over a short-term period (say 50bp in a month) would weigh on broader risk sentiment and leave EM assets vulnerable to capital outflows (reflected by US$35bn of EM debt portfolio outflows in March 2020 following the Covid-19 induced sell-off).
Higher financing costs would intensify debt sustainability challenges for some
In such a scenario, high yield sovereigns would come under substantial pressure given the lack of market liquidity owing to a narrower investor base and scrutiny for external vulnerabilities (notably FX reserves adequacy and external/FX-denominated debt). Eventually, this would likely also translate into higher financing costs here which would intensify debt sustainability challenges for some. We identify Bahrain, Egypt, Oman, South Africa, Sri Lanka, Turkey, and Ukraine as more vulnerable among the larger sovereign Eurobond issuers.
We assume that EM corporate bonds can absorb up to 30-50bp of a US Treasury yields upward shock, based on (1) a relatively short modified duration (4.9 years based on Bloomberg Barclays Indices) and (2) still attractive yields/spreads in relative terms (Z+311bp or 3.6%). Thus, EM corporate credit might be considered as a defensive strategy.
Nonetheless, a larger shock would have different implications within the space: investment-grade corporates might hold well while HY corporate debt should come under intensified pressure. We would be especially wary of banks’ subordinated and perpetual bonds as they historically have been more vulnerable during times of high market volatility.
Within CEEMEA, this would be the case for Russian and Turkish subordinated bonds, but also for higher beta senior bonds from Ukraine.
In line with this, a renewed tantrum would shake all subordinated risk assets in Russia, Turkey, and Ukraine. Prolonged volatility amid rising rates might restrict corporate access to external funding sources which, if coupled with weakened EM currencies, could result in increased liquidity and refinancing challenges.
Disclaimer: This publication has been prepared by ING solely for information purposes irrespective of a particular user's means, financial situation or investment objectives. The information does ...
more

