
Time To “Buy The Dip” & Bitcoin’s “Golden Cross”
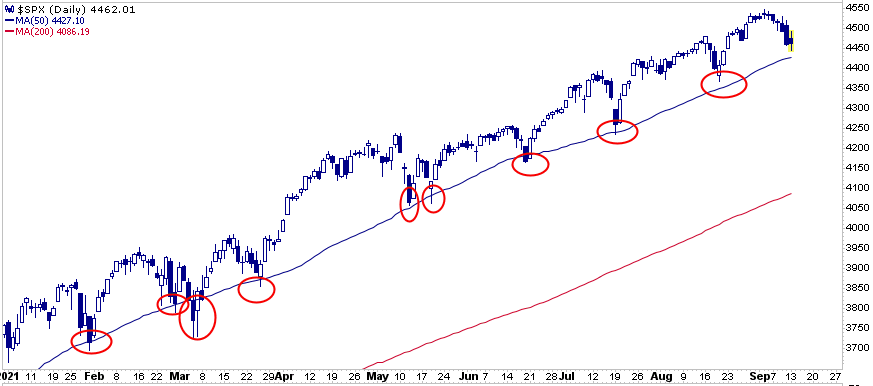
Is it time to “Buy The Dip?” The S&P 500 broke its five-day losing streak, as it rose .25% on Monday to 4470, 1.00% above its 50-day moving average. As we graph in the commentary below, the 50-day moving average has supported the S&P 500 on nine separate occasions in the last year. We have no reason to doubt the power of the trading algorithms this time around, but we must consider a meaningful break of the moving average could put the 200-day moving average in play at 4086.
Markets are opening slightly higher this morning while bonds are giving up some of yesterday’s gains. At 8:30 am ET, CPI provides an update on inflation. Expectations are for the headline monthly number to decline 0.1% from last month’s 0.5%.
Will The 50-Day Moving Average Save the Day?
(Click on image to enlarge)
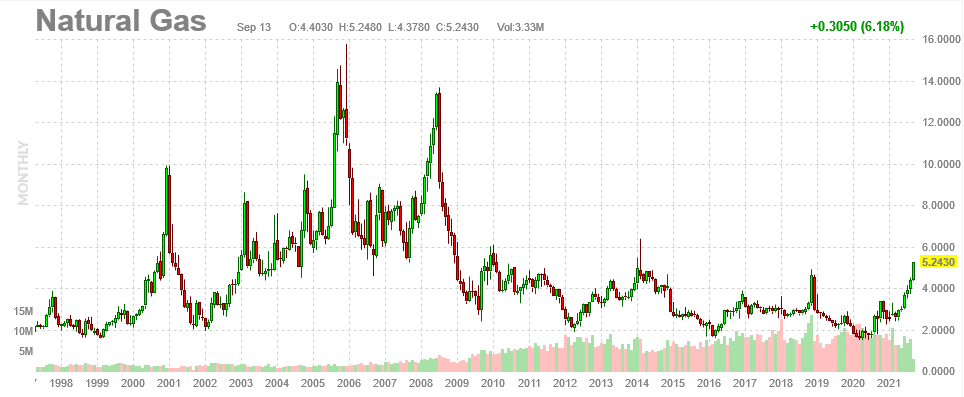
Nat Gas is on Fire!
As we show below, the price of Natural Gas is up sharply over the last few months sitting at the upper bound of its 10-year range. Will it break higher or fall back as it did in 2014 and late 2018 when it was at similar levels?
(Click on image to enlarge)
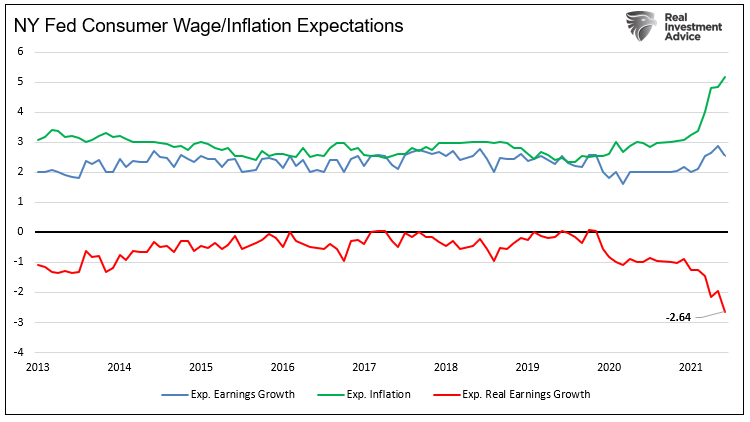
Inflation and Confidence
The New York Fed, via their latest Consumer Expectations Survey, shows the role that rising inflation expectations are having in declining confidence. The graph below shows expected inflation is now over 5% and rising. At the same time expected wage growth is 2.5% stable/falling. As a result, consumers expect to lose 2.64% (red line) in purchasing power over the next year.
(Click on image to enlarge)
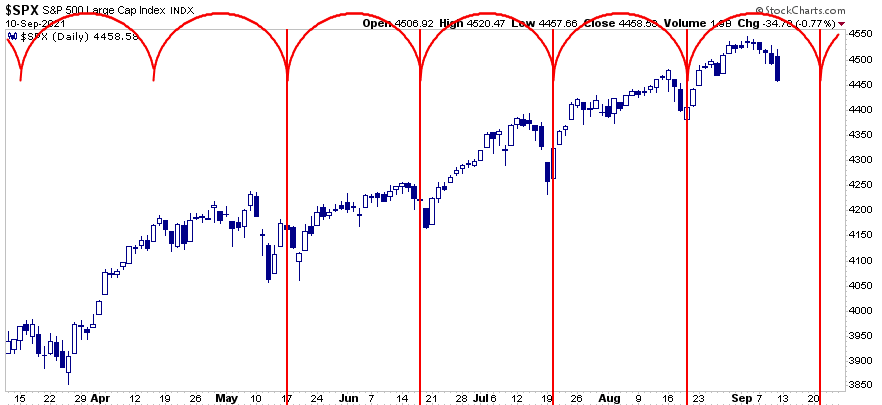
Will the Market Bottom on September 21st?
The graph below shows the incredible regularity of the market over the last four months. As shown, every 20 days the S&P 500 tends to decline for a few days, bottom, and then rally back to prior highs. If the cycle plays out again this month we should expect a market bottom on 9/21. Monthly options expirations, which fall around the market troughs, are largely responsible. Liquidity is lacking, so options-related trades are driving direction on the days surrounding expirations.
(Click on image to enlarge)
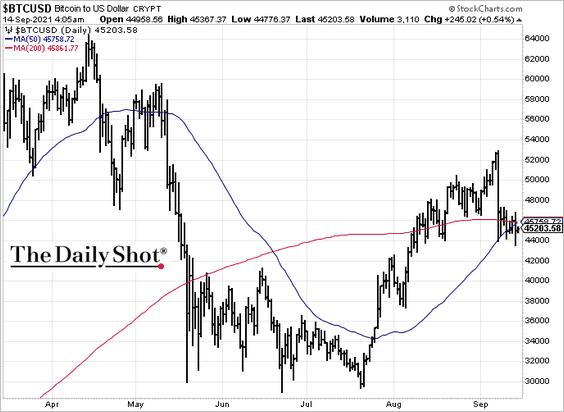
Bitcoin’s Golden Cross
After a drubbing earlier this year, the August surge has led to a “Golden Cross” of the 50-dma and 200-dma moving averages. Bitcoin needs to hold support at these levels and turn higher to confirm the “bullish signal.” If it does, such would suggest a run back towards $60,000 is likely.
In a recent CNBC interview, Cathy Wood, CEO of ARK Investments stated that she expects Bitcoin’s price to top $500,000 in the next five years.
“If we’re right, and companies continue to diversify their cash into something like crypto, and institutional investors start allocating 5% of their funds toward crypto…We believe that [bitcoin’s] price will be tenfold of where it is today.”
Wood also said her confidence in Ether “has gone up dramatically,” as the blockchain starts its transition from proof-of-work to proof-of-stake.
When asked by CNBC what her picks are, if only investing in one cryptocurrency, Wood said she would allocate 60% to bitcoin and 40% to ether.
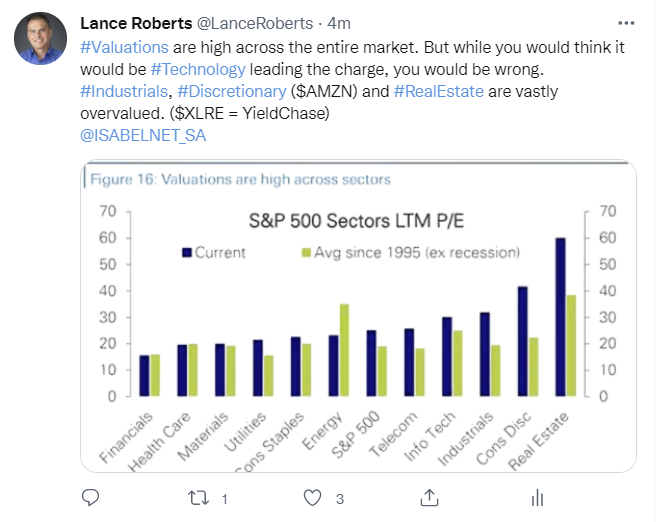
Valuations Are “Crazy”
Bracing for CPI
CPI on Tuesday is the big market event of the week. Given the Fed is making substantial progress toward its employment goal, inflation concerns are moving front and center. While the Fed laid out a timeframe for taper in the WSJ last week, high CPI could speed that schedule up. Expectations for the monthly rate are 0.4%, slightly less than last month’s 0.5%.Also of importance this week is Thursday’s Retail Sales report. Will the recent plunge in confidence be felt by retailers? Speaking of confidence, the University of Michigan Consumer Survey will come out on Friday.
Next Tuesday and Wednesday is the next Fed meeting. Later this week most Fed members will enter the media blackout period.
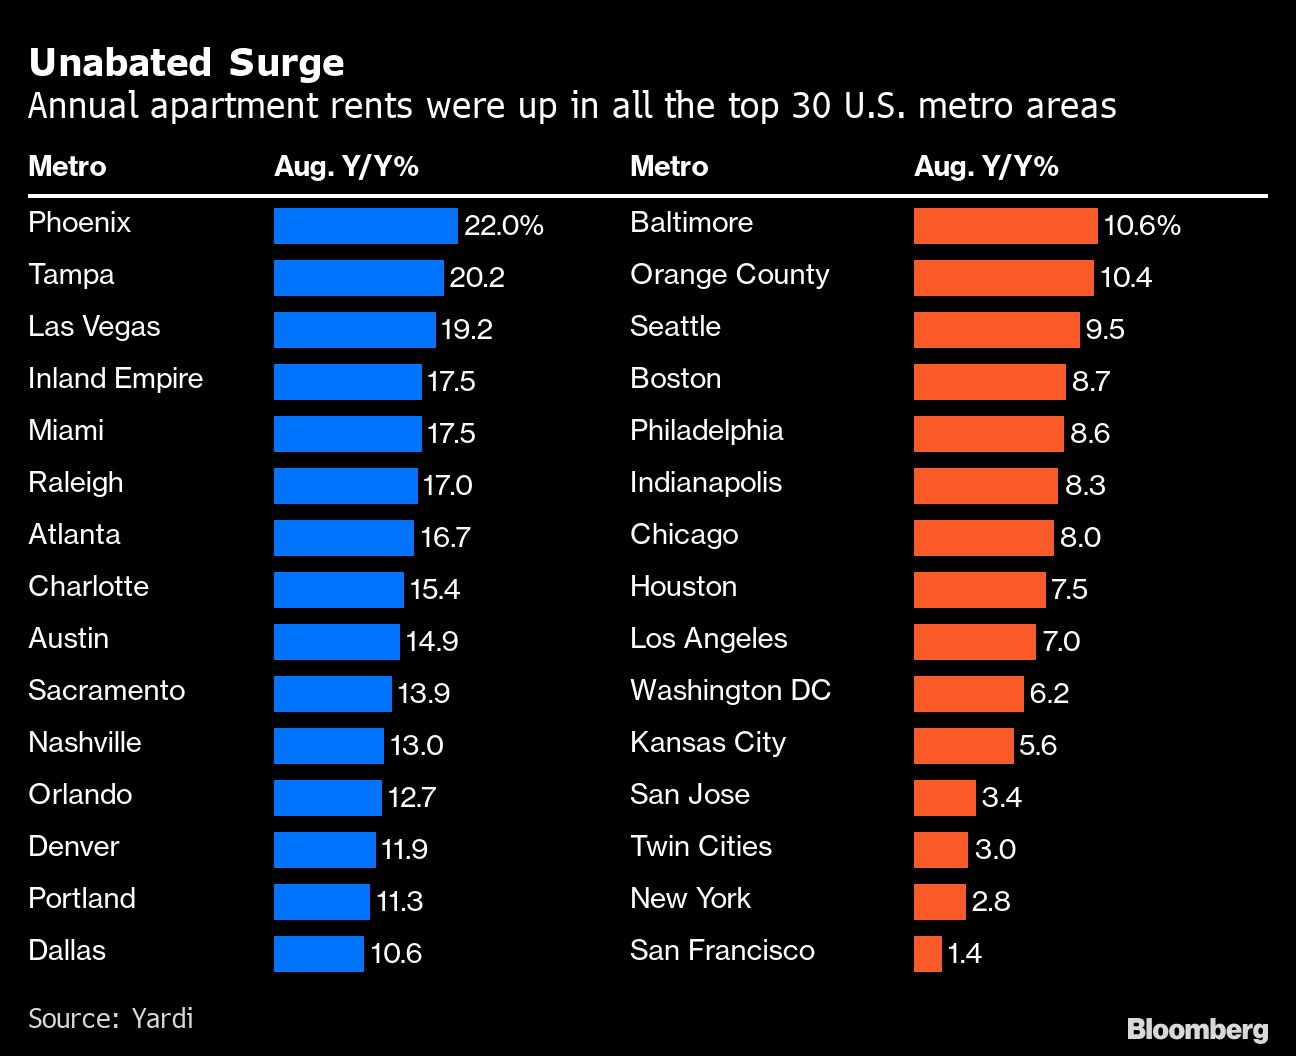
Rental Inflation
30% of the CPI index is based on “Shelter” cost, i.e. real and imputed rental prices. The graph below should provide a warning that tomorrow’s CPI report can run hotter than expected. Luckily, the BLS uses questionable means to calculate rent. In BLS’ Housing Inflation Measure is Hypothetical Bull*** we analyze “Shelter” costs. Our conclusion: “If either OER or Rental prices show some correlation to reality, CPI could not only continue to run hot but could rise from elevated levels. That said, looking at historical BLS data, it appears Shelter prices will not change markedly from current levels.”
Disclaimer: Click here to read the full disclaimer.


