
Time Series On Term Spreads, Yield Curve Snapshots
Part of the yield curve is already inverted.
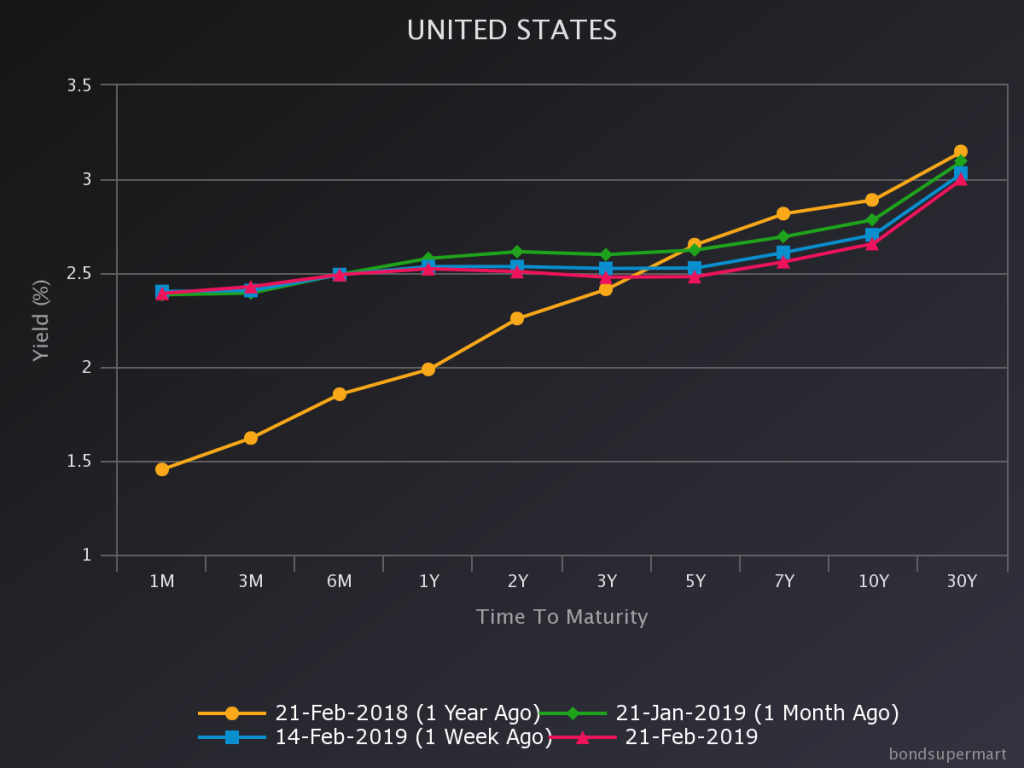
Figure 1: Yield curves as described. Source: Bondsupermarket.com.
Notice that inversion occurs at the 2-3 year maturities; the key 10yr-3mo spread continues to decline, while the 10yr-2yr spread has stalled.
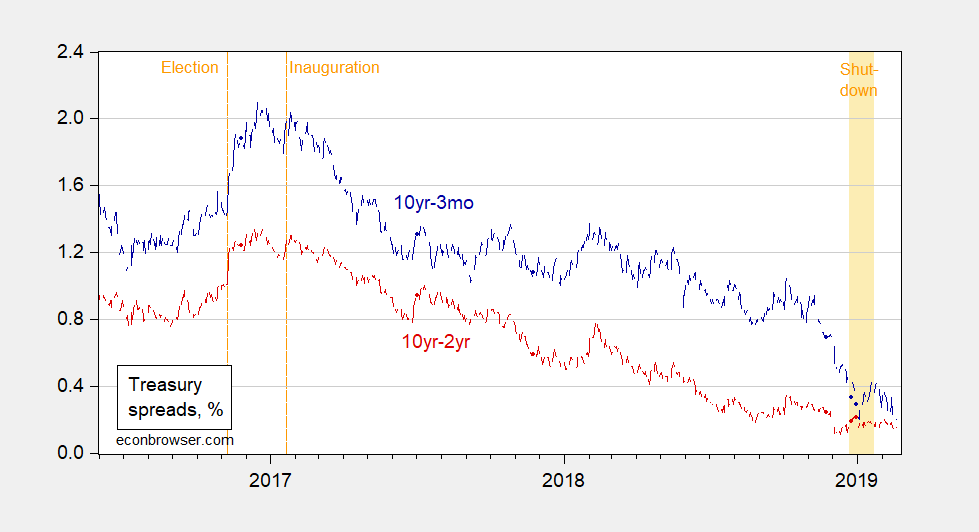
Figure 2: Ten year-3 month Treasury spread (blue), and ten year-two year Treasury spread (red). Source: Federal Reserve via FRED, Treasury Department, author’s calculations.
The inversion at the 2-3 year maturities suggests lower short rates in the near future.
Disclosure: None.
How did you like this article? Let us know so we can better customize your reading experience.

Comments
Leave a comment to automatically be entered into
our contest to win a free Echo Show.

