
Three Warning Signs For Commercial Real Estate And REITs
Forecasting the direction of real estate prices requires the same disciplined approach as for other goods and services. Here are three reasons why commercial real estate supply exceeds market demands, and the implications for your clients and their REIT investments.
Commercial real estate continues to be touted by analysts and media pundits as a sound investment. Since I have been one of the few consistent dissenters from this euphoric optimism, now is a good time to briefly review what I have been saying over the past few years.
In my article on commercial office markets published here three years ago, I pointed out that the red-hot sales of 2014 were very uneven. Nearly half of all investor money had poured into just five major metros – Manhattan, Boston, San Francisco, Los Angeles and Washington DC.
It was a very different story in most of the other major markets where weaknesses left over from the crash of 2008-2010 were still evident. Real estate data firm Cassidy Turley reported that 18 of the 79 major metros which they tracked showed higher vacancy rates in late 2014 than a year earlier.
Cassidy Turley also emphasized that the absorption of office space around the country since 2010 had been very narrowly focused. All the new space absorbed by tenants were in buildings either newly-built or newly renovated. Owners of traditional, older space, which comprised 60% of all office buildings in the nation, were still struggling to find tenants.
I warned investors not to be fooled by the strength shown in the hottest half dozen markets.
My follow-up article published in the summer of 2016 reported the cooling was showing up even in the hottest markets. Although total nationwide sales volume for 2015 had nearly reached the insane levels of 2007, this was due to continued enthusiasm shown by investors for those same six major metros. Manhattan alone accounted for 20% of all office sales.
By the middle of 2016, signs were beginning to appear that all was not well in the hottest markets. A construction boom throughout Greater San Francisco was throwing nearly 10 million square feet of new space onto the leasing market while the IPO market in Silicon Valley had slowed drastically. The soaring amount of sub-lease space thrown onto the market by firms that had leased too much during the boom years was another sign that the market was deteriorating.
Even Manhattan was weakening. Office sales volume was lower than a year earlier and available sub-lease space in the previously red-hot Midtown South was also rising rapidly.
While it was too soon in mid-2016 to say that office markets were topping out in the hottest major metros, I pointed out to readers that slowing sales volume was a clear warning signal for investors.
Here are three reasons why investors should be concerned about the commercial real estate market.
1. Declining sales volume
The most important indication that markets have peaked is a decline in sales volume. As 2017 unfolded, the weakening in sales became increasingly apparent. By November of last year, office sales nationwide were down 31% annually from November 2016 according to Real Capital Analytics.
The plunge in sales was most severe in what had been the hottest market in the nation – Manhattan. After peaking at $10 billion in the first quarter of 2015, sales had declined steadily and collapsed to under $1 billion in the third quarter of last year. The disappearance of Chinese money after the crackdown on foreign real estate investing by the Chinese government was clearly one of the major factors, but it was not the only one.
Sales in San Francisco – the second hottest market –collapsed in the fourth quarter of 2017. A mere two sales were closed in the entire quarter for a total of only 300,000 square feet. Take a look at this chart from Yardi Matrix:
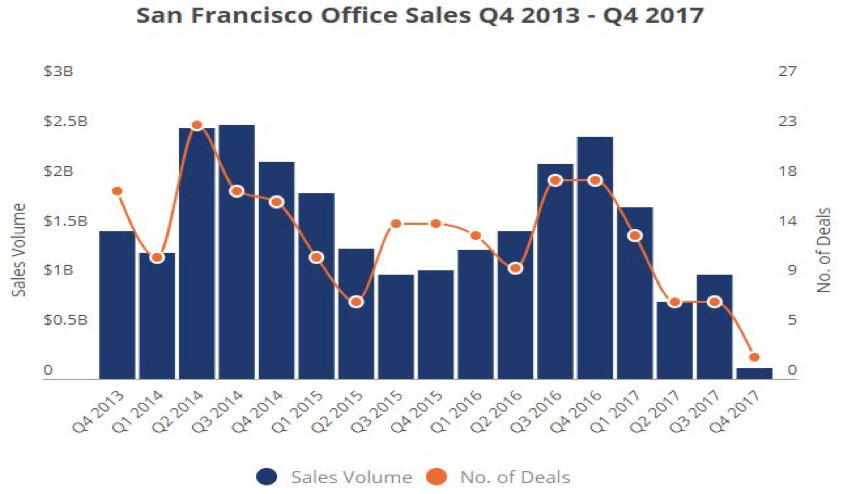
Source: Yardi Matrix
For all of 2017, sales were down 58% from 2016. Chinese buyers – so important the past few years – simply did not show up.
At the time my first article was published in 2015, the third hottest markets were the Texas metros of Dallas and Houston. By the last quarter of 2017, both of them saw sales slow substantially – down 30% from the year-earlier fourth quarter according to Yardi Matrix's Texas report. For all of Texas, average price per square foot had plunged 36% from a year earlier.
The key takeaway from these sales figures is simple. Office investors are no longer willing to pay the sky-high asking prices of 2015. Because sellers have proven very reluctant to drop their asking prices, potential buyers walked away. One of the most important reasons for this is the more than 100 million square feet of new office space under construction now around the country.
Changing expectations of investors are another key factor. National Real Estate Investor magazine (NREI) conducts a monthly survey of its readers to gauge what percentage of them believe that commercial real estate has peaked. Those surveyed are mainly professionals actively involved in real estate markets. This percentage has soared from a mere 12% in January 2015 to 59% in November 2017.
2. The boom in construction of new office buildings
The growing belief that markets have peaked as reported in the latest NREI survey has been influenced by soaring construction of offices in the major metros. The most recent figure from brokerage giant Cushman & Wakefield shows 102 million square feet of office space now under construction. Data provider Co-Star reports an even higher number – 120 million square feet.
In its U.S. Office Marketbeat Report for Q3 2017, Cushman & Wakefield emphasized that “The big story of the national office market will be the substantial amount of new construction over the coming year.”
There is a long lag time between construction starts and completions. Soaring optimism of developers in 2015 led to a record start of 61 million square feet in 2016. When net absorption of space declined in 2016 from the peak a year earlier, developers sharply cut back on new starts in 2017 by 30% according to the real estate investment management firm, JLL. Unfortunately, the record starts in 2015 and 2016 resulted in nearly 60 million square feet hitting the market in 2017. Cushman & Wakefield expects nearly 70 million square feet to be completed this year. Digesting this space will prove difficult.
As with office sales volume, the office construction boom has been concentrated in a handful of major metros – Manhattan, San Francisco and Silicon Valley, Washington DC, and Dallas. These five markets accounted for nearly half of all new office space under construction in the nation.
Let's take a look at several of these markets. Greater San Francisco is dominated by its massive tech sector in Silicon Valley and the Bay area. Hi-tech office employment soared between 2013 and 2015. However, the net absorption of office space peaked in 2015 and has declined substantially since then as office employment flattened out. Unfortunately, developers in Silicon Valley began a construction boom which tripled the amount of new office space coming onto the market between 2013 and 2017.
At the same time, new construction coming online has risen dramatically. Together, San Francisco and Silicon Valley have more than 12 million square feet of new office space that was either completed in 2017 or is still under construction. This is nearly 10% of the total inventory of these two markets which simply cannot be absorbed at current asking rents. That is why the vacancy rate in Silicon Valley soared to 17% by the end of last year according to JLL.
In the Greater Washington DC market, roughly 16 million square feet of new office space was either completed in 2017 or currently under construction now according to JLL. The vast majority of new construction is class A space. Class A vacancy rose to 16.4% by the end of last year and is expected to rise this year as job growth moderates.
The Dallas-Ft. Worth market (DFW) has seen huge employment growth over the last several years. As a result, new office construction soared with nearly 13 million square feet completed in 2017 or now under construction. That was up from a mere 2.7 million square feet in early 2013. Although Collier Int'l showed a net space absorption of a healthy 5.6 million square feet in its 2017 office report, 2/3 of that was due to move-ins to single-tenant buildings by large companies including Toyota's move to its new 2.1 million square feet headquarters.
Cushman & Wakefield states that there were roughly 13.3 million square feet of office space under construction in Manhattan at the end of 2017. Nearly all of it is expensive Class A space. However, in its fourth quarter 2017 Manhattan report, Savills-Studley claims that there is 18.8 million square feet of new office development underway. Savills-Studley's assessment in their report was that “it will become increasingly difficult for demand in Midtown to keep pace with supply.”
3. The continued rise in rent concessions and tenant improvement allowances (TIAs)
While office supply is fairly easy to quantify, the demand for space is more difficult to ascertain. Is there something that can tell us the strength of office space demand?
The place where supply and demand fight it out in the marketplace is rents and concessions to tenants. No business wants to pay more than it has to when it comes to office space. It is too large an expenditure. Are there indications in major metro markets that the demand for space is weakening?
Let's begin with the largest and most important market – Manhattan. For the complicated Manhattan market, it is necessary to approach the question of demand from several different ways. One way is to look at the amount of space leased. Last year, 37 million square feet was taken by tenants. This was up a little from 2016 but down slightly from the post-crash peak in 2014. While this suggests strong demand, it does not tell us enough by itself.
A more important measure is the amount of space put onto the sublet market. Companies that have leased more space than they actually need will often offer it on a sub-lease basis. This chart from Collier's Int'l shows the steadily growing amount of space offered on the Manhattan sublet market.

By the end of last year, more than 10 million square feet of space was being offered for sub-lease. That is much greater than at the bottom of the market collapse in 2009. The rising amount of sublet space tells us that many companies in Manhattan leased more space than they had expected to need. Often, this was done in anticipation of growth that simply did not materialize.
A third measure of demand is whether average asking rents were rising or falling. Collier's Manhattan office report for the fourth quarter of 2017 reveals that average asking rents for the entire Manhattan market rose steadily from 2009 to 2015. The figure flattened out in 2016 and then declined slightly last year.
The problem with relying on asking rent figures is that they are merely what landlords are asking tenants to pay for their space. Effective rents are the key metric – what tenants actually pay after taking into account concessions such as first-year free rent and what are called tenant improvement allowances (TIA). TIA is the landlord's cost of customizing a space to the specific needs of the tenant. These concessions tell us more than anything else how strong or weak is the demand of tenants for space.
The Greater San Francisco leasing market would appear to be strong at first glance. In the second half of 2017, leases were signed for more than 9 million square feet in Silicon Valley alone. A caveat, however, is that this leasing has been dominated by the giant tech firms such as Amazon, Facebook, and Google that often took entire buildings. Smaller firms are much more reluctant to add new space.
A key sign of waning demand in Silicon Valley is that available sublease space had doubled to 6 million square feet in the 12 months between mid-2016 and mid-2017. This was clear evidence that tech firms had leased much more space than they needed during the boom years of 2013-2016. Savills-Studley's fourth quarter 2017 office market report gave further indications of weakening demand. It reported that the vacancy rate for class A space in Silicon Valley had climbed to 18.6%.
Leasing activity in the city of San Francisco became a high tech affair in 2017 with nine of the 10 largest leases taken by tech giants such as Facebook, Amazon, and Google. Most were deals for mega-blocks of office space in buildings still under construction. In the fourth quarter, Dropbox inked a long-term deal for more than 700,000 square feet. This was the largest lease signed in the history of San Francisco. Nearly 11% of the city's total office inventory was leased last year, the highest percentage in the nation. Is it any wonder that asking rents in these new buildings approached a sky-high $80 per square foot?
According to Savills-Studley, total office-using employment was actually down slightly in San Francisco in 2017 from the preceding year. Is this an indication that tech firms have been gobbling up space in anticipation of future needs that may or may not materialize? In its fourth quarter 2017 San Francisco report, Savills-Studley was confident that tech firms were warehousing space for years to come. Rapidly rising concessions to tenants since 2015 is another indication that demand throughout the San Francisco office market is slowing down.
Weakness in the Dallas/Ft. Worth market is fairly apparent. Colliers Int'l reported a vacancy rate of only 15.8% at the end of 2017. Cushman & Wakefield showed a slightly higher overall vacancy rate of 16.7%. Yet Savills-Studley reported a much higher availability rate of 24% for the same period in its fourth quarter 2017 DFW report. That was up by nearly two percentage points from a year earlier. While the availability rate is a slightly different measurement than the vacancy rate, it is also a good indication of the weakness of office space demand.
Although Colliers reported the lowest vacancy rate among these three data providers for the entire DFW metro, its breakdown of the DFW market by building size showed vacancy rates that were very close to Savills-Studley's figures. Most of the Dallas office market is comprised of buildings greater than 100,000 square feet. Together, these office buildings had an average vacancy rate in excess of 20%. Buildings between 500,000 and one million square feet had an average vacancy rate of 22.5%. The largest buildings – each over one million square feet – had an average vacancy rate of 26%.
Let's look at one more of the hottest markets from 2014-2015 where investors poured money into purchasing offices– the Washington DC metro. As I explained earlier, new construction has soared there in the last few years.
Although leasing activity picked up in the fourth quarter of last year, most of the largest leases were relocations or renewals. In its fourth quarter 2017 report for the DC metro, Cushman & Wakefield emphasized that rent abatement concessions up to a year and very generous tenant improvement allowances were necessary to close long-term deals.
Savills-Studley's latest report pointed out that space availability for the entire metro had reached the highest rate since 2010 with Northern Virginia climbing to nearly 22%. JLL noted that asking rents have declined by as much as 10% in some class A sub-markets. After adding in generous concessions to tenants, effective rents have declined even more.
All three of these real estate data providers indicated that there was no end in sight for this weakness in demand. Adding together the huge amount of new office space which came online in the DC metro in 2017 to the five million square feet scheduled for completion in 2018 and the nearly three million which will break ground this year, they warned that this total supply would overwhelm demand for the foreseeable future.
What about office REITs?
Many of your clients may own equity REITs, including those which have invested mainly in office properties. What should they do? In the February 19 issue of Barron's, there is an article entitled “A Good Time to Buy REITs.” Without saying a word about the market fundamentals that I have discussed, the author states that “REITs now could be flashing one of their strongest buy signals in years.” Really?
Those clients of yours who read the Barron's article may have been persuaded by the author's recommendation. To help you set realistic expectations, you can refer them to the article about REITs that I wrote three years ago. In it, I provided the details of how the price of several large office REITs collapsed in 2008-2009. Have them read this article to understand fundamentals that are essential before making any decision to buy or sell. The key question an office REIT investor must answer is whether the price of the security they own or plan to buy reflects the supply and demand dynamics that I have discussed here.
Conclusion
The focus of this analysis has been on the hottest major markets because that is where most investment money has gone. It has shown you three serious signs that these formerly hot office markets are weakening and have topped out. The question your clients should ask is whether they should ride out what might be only a temporary softening or unload at least some of their office portfolio before the downturn becomes more evident.
My view is that it is usually wise to follow what Sam Zell – probably the savviest real estate investor in the nation – has done. By the end of 2015, he had watched prices reach levels that were excessively high. Zell declared that “it is very hard not to be a seller” and sold a substantial portion of his remaining commercial real estate portfolio. He is not an investor who waits until the signs are obvious to everyone.
Disclosure: None.


