
This One Chart Says Gold Prices Could Hit $2,100

iStock.com/Aliaksandr Bahdanovich
Gold Prices Could Be Setting Up to Soar
There’s one chart that says gold prices could be setting up to make a move toward $2,000 and beyond.
Please look at the chart below. It plots the monthly gold price. Also, pay very close attention to the black lines drawn on the chart.
(Click on image to enlarge)
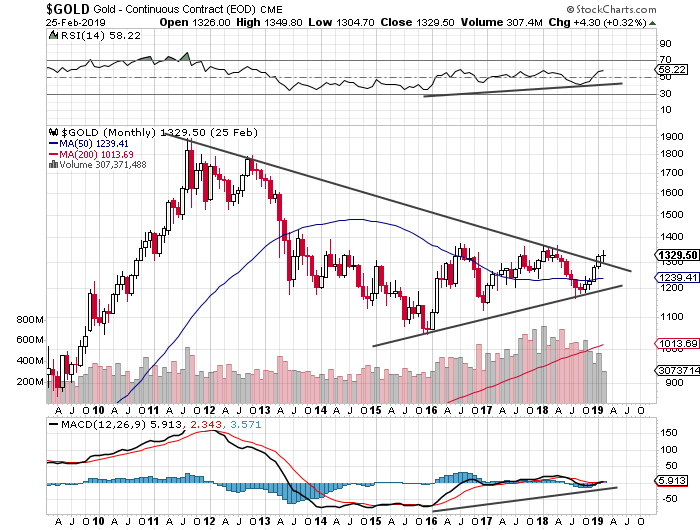
Chart courtesy of StockCharts.com
Over the past few years, on the gold price chart, we were seeing the formation of a chart pattern called a symmetrical triangle.
What is a symmetrical triangle? It forms when there is a preceding downtrend and a developing uptrend. Usually, the price is consolidating (the trading ranges are getting smaller) when this happens.
A symmetrical triangle isn’t a bullish or bearish pattern. You can only tell where the price will move once it breaks out of the triangle.
If the price breaks above the triangle, an upside move usually follows.
If the price breaks below the triangle, a downside move usually follows.
Thanks to the move in gold prices over the past few months, the gold price has broken out of the triangle.
As gold prices moved higher, momentum indicators like the moving average convergence/divergence (MACD) and the relative strength index (RSI) indicators trended higher as well.
Remember, without momentum, you really can’t do much.
These two momentum indicators are suggesting that the momentum is in favor of the buyers. The buyers are increasing in number; they are controlling the price and could take it much higher.
Saying the very least, this is all very bullish for gold prices.
How High Could Gold Prices Go?
When it comes to technical analysis, there are some guidelines on where the price could go after there’s a certain trigger.
With a symmetrical triangle, there are targets as well.
Technical analysts usually take the widest part of the triangle (the price range) and add or subtract it to the breakout point, depending on whether the price broke above or below the triangle.
In the chart above, there are two instances where the widest part could be used.
First, the price action between late 2011 and late 2015—that’s roughly $800.00.
Second, the price action between early 2016 and late 2017—that’s about $300.00.
In the chart above, the breakout level is around $1,300.
If you want to be skeptical, then add $300.00. With this, gold prices could reach as far as $1,600. That is 20% above the current gold price.
If you want to be generous, then add $800.00. This takes gold prices to as high as $2,100. That is 58% above the current gold price.
This Is Where You Could Make Stellar Returns…
Dear reader, I have publicly said that gold miners could be the next millionaire makers. I still believe in this.
It must be understood that gold mining stocks provide leverage gains to gold prices. A one-percent increase in precious metal prices could mean a five-percent increase in some mining stocks.
Consider the chart below to get some perspective on the leverage that mining stocks provide to gold prices.
(Click on image to enlarge)
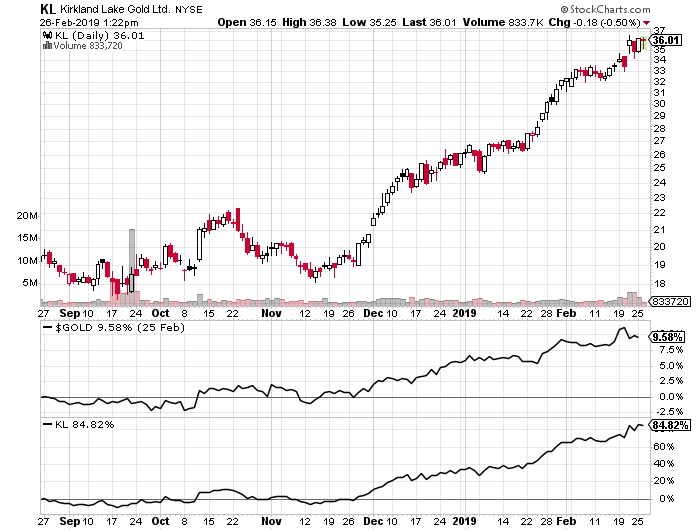
Chart courtesy of StockCharts.com
Kirkland Lake Gold Ltd (NYSE: KL) increased by 84.82% in the past six months as gold prices increased by 9.58%. So, for every one-percent increase in gold prices, KL stock increased by 8.85%.
If gold prices increase by even 20% from their current levels, it wouldn’t be shocking to see a number of gold mining stocks double in value, if not more.
Disclaimer: There is no magic formula to getting rich. Success in investment vehicles with the best prospects for price appreciation can only be achieved through proper and rigorous research and ...
more

