
This Is The Most Important Chart You’ll See Today
Breadth is starting to breakdown.
As I write this, breadth are on the verge of breaking a bearish rising wedge formation.
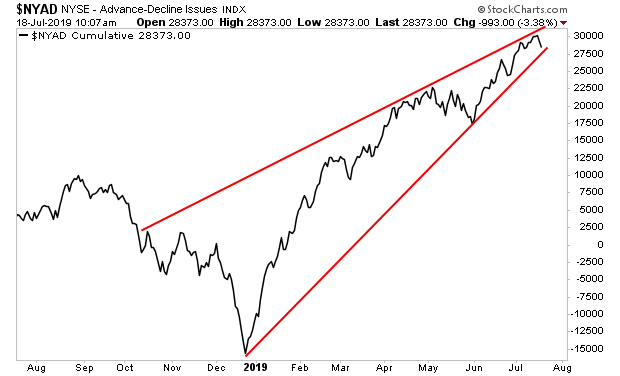
Why does this matter?
Because breadth leads stocks.
Throughout 2018, breadth (black line) was warning that stocks (blue line) were due to correct (red squares in the chart below).
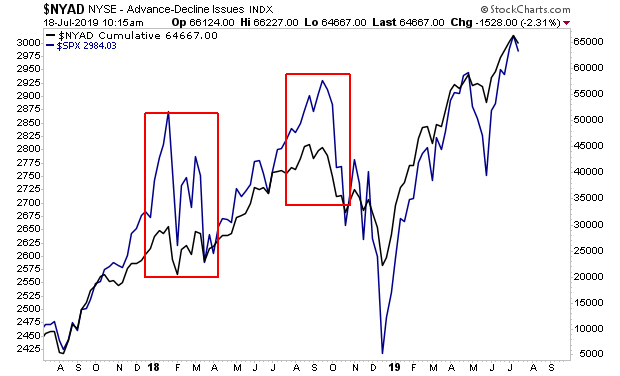
Breadth was right.
More recently, in late 2018 and mid-2019, breadth (black line) was telling us that stocks (blue line) had overdone it during their corrections (green squares in the chart below).
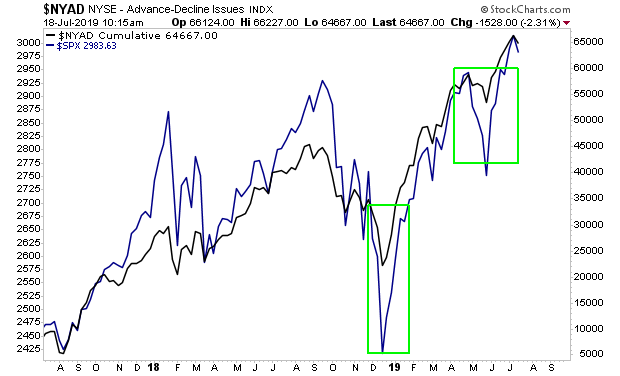
Again, breadth was right.
Which is why, today, when breadth is warning of a MAJOR breakdown, traders need to prepare in advance…
On that note, we are already preparing our clients for this with a 21-page investment report titled the Stock Market Crash Survival Guide.
In it, we outline the coming collapse will unfold…which investments will perform best… and how to take out “crash” insurance trades that will pay out huge returns during a market collapse.
Today is the last day this report will be available to the general public.
To pick up one of the last remaining copies…


