
There Is Change Afoot In The New Year

The State of the Market
Good morning and welcome back to the land of blinking screens. It is my sincere hope that everyone enjoyed the long, holiday weekend - I, for one, needed some rest! But now it's time to get back to it.
As we venture forth into the "brave new world" that is 2021 (hat tip to Jeff Pietsch, CFA), it is common for investors of all shapes and sizes to assume that the markets will continue to act in a manner similar to what they had been as the prior calendar year came to a close. However, in looking around at the landscape, I see changes taking place - on many levels.
Interest Rates
For starters, the interest rate environment has clearly changed. Instead of the steady downtrend that saw the yield on the 10-year fall from 3.2% in November 2018 to the astonishing nadir of 0.7% on March 6, 2020, rates are now in a defined uptrend. And the move has accelerated so far this year in response to the "Blue Wave," which is expected to bring more stimulus (and in turn, more borrowing) and higher tax rates.
Although I don't believe stocks will be bothered by rates until/unless the yield on the 10-year becomes a realistic alternative to dividends paid on stocks, it is worth noting that the Aggregate Bond Index (using AGG as a proxy) sports a loss of -0.80% on the year so far (source: Morningstar). As such, one of last year's portfolio tailwinds appears to have turned into a headwind.
The Economy
Another potential tailwind-turned-headwind is the state of the economy. Yes, stocks are indeed a discounting mechanism of future expectations and thus, investors are looking ahead to better days. But it is worth noting that the services sector is struggling again in response to the new lockdowns being enforced in many parts of the country/world.
COVID-19
And yes, I also recognize the vaccines are here and will afford everyone the ability to return to some form of normalcy in the future. The question, of course, is when will enough people be vaccinated to achieve herd immunity and turn COVID-19 and its expanding variations into nothing more than another strain of the flu?
So far at least, investors continue to look past the time it will take for enough shots to get into people's arms. However, it is worth noting that "the last mile" of the vaccine's journey has been more than a little bumpy so far.
Stock Market Leadership
Also on the topic of "looking ahead," it is hard to ignore the eye-popping change in stock market leadership. Gone is the mega-cap tech dominance as the FAMANGs and many "COVID winners" have been going nowhere fast for several months now. Instead, 2020's laggards such as small caps and cyclicals have been moving up to the front of the pack - in rapid fashion.
A quick example of this change is the year-to-date scorecard of the market indices. Last year's darling, the NASDAQ 100 (ETF proxy QQQ) is negative so far in 2021 while the Russell 2000 (using IWM as a proxy) is up nearly 7.5%. So, while the spreads between the various indices remain wide again this year, the leaders have definitely changed.
And... Inflation
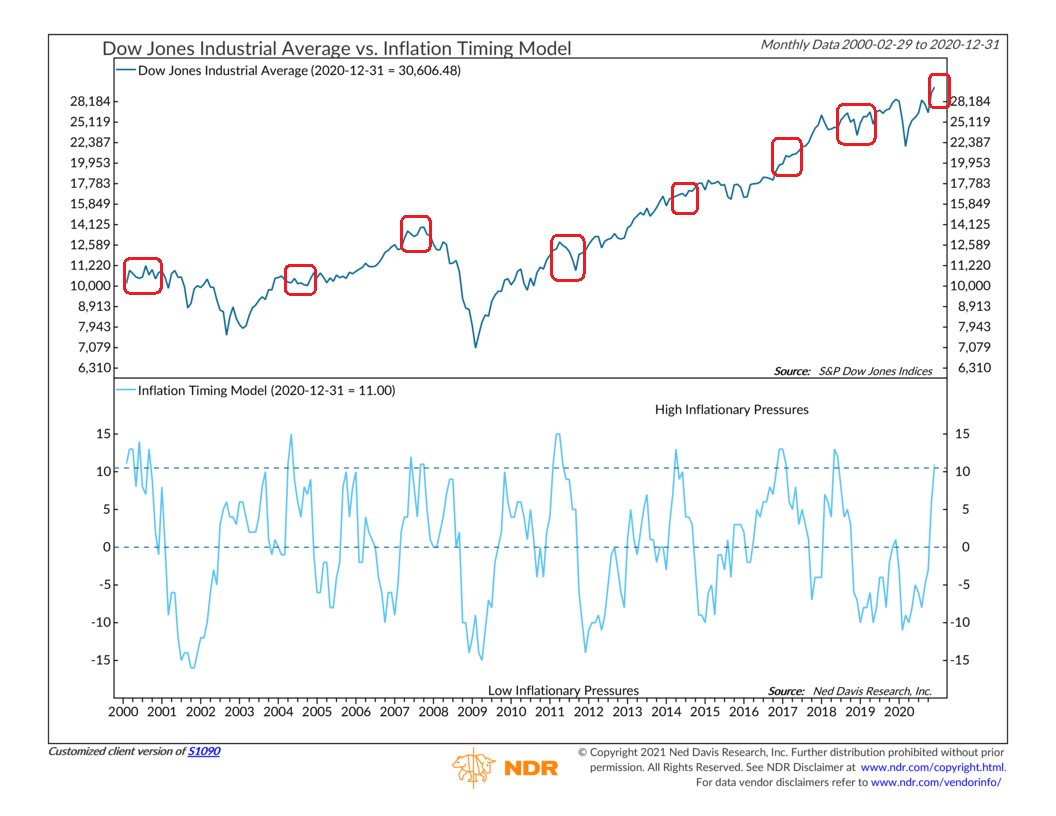
Finally, it is worth noting that that a change in inflation expectations is occurring right before our very eyes. Don't look now fans, but our Inflation Timing Model just flashed a sell signal - the first such signal since May 2018.
Before you start clicking the buy button on those inverse-ETFs, let me state clearly that I do NOT believe we are witnessing the type of runaway inflation that produced the secular bear in the 1970's. No, nothing like that looks to be happening here.
But I think it is very important to note that inflation expectations ARE rising. For real. And given that inflation "can" be considered a bull killer in certain circumstances, I'd be remiss if I didn't mention the changing inflation picture.

View Full Size Chart Online
* Source: Ned Davis Research
Frankly, I don't think we're dealing with a "bull killer" situation as it the Fed isn't likely to even make mention of inflation until/unless we see significant price increases for a sustained period. And while inflation could certainly perk up a fair amount as the economy returns to normalcy as businesses raise prices in response to new costs, an inflation nightmare scenario doesn't seem to be in the cards at this time.
So, what should we make of the new inflation picture? If you look closely at the chart above, you'll see that Inflation sell signals since 2000 have not consistently led to big declines in stock prices. No, the vast majority of the time, a pause or garden variety pullback ensues. So, please don't take my mention of this particular signal as a reason to turn uber bearish.
For me, the key takeaway is that another past tailwind now appears to be a potential headwind, albeit a gentle one at the moment.
But... Given that valuations need to be considered Extreme (with a capital E) and investor sentiment has become nothing short of frothy, it may not take much to usher in the next pullback, correction, pause, or sloppy period in the market. In other words, there are enough things changing that I now see the risk environment as elevated.
It is for this reason that I don't mind having a little dry powder at the present time. And yes, I will be keeping an eye out for opportunities to put money to work when/if things get dicey, because, from my seat, this remains a buy-the-dip environment.
Now let's turn to the state of my favorite big-picture market models...
The Big-Picture Market Models
There is a change to report on the Primary Cycle board this week as the Fundamental Factors Model moved from neutral to negative. But with the rest of the board sporting a healthy shade of green, I will continue to give the bulls the benefit of the doubt for a while.
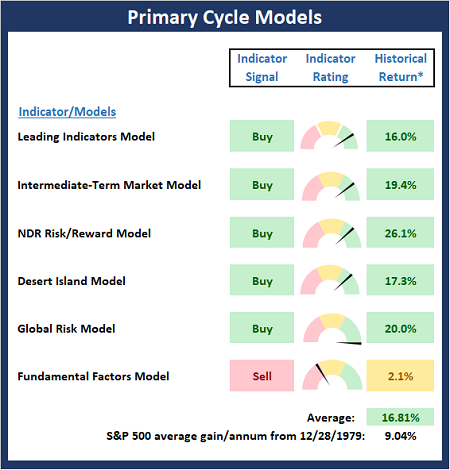
* Source: Ned Davis Research (NDR) as of the date of publication. Historical returns are hypothetical average annual performances calculated by NDR.
Fundamental Factor Models
While the market continues to look ahead to "shots in arms" and a return to economic normalcy, the Fundamental board continues to falter. For the first time in many moons, there are no buy signals on the board. And with four sell signals, we need to recognize that risk is elevated.

* Source: Ned Davis Research (NDR) as of the date of publication. Historical returns are hypothetical average annual performances calculated by NDR.
"Primary" Cycle History
I have found that checking in on state of the cycles and the weekly/monthly charts helps to keep the big-picture in perspective.
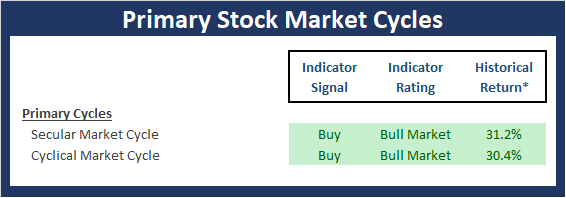
* Source: Ned Davis Research (NDR) as of the date of publication. Historical returns are hypothetical average annual performances calculated by NDR.
The Secular Market Cycle
Below is a monthly chart of the S&P 500 Index illustrating the current cycle, which we estimate began on March 9, 2009.
S&P 500 - Monthly

View Full Size Chart Online
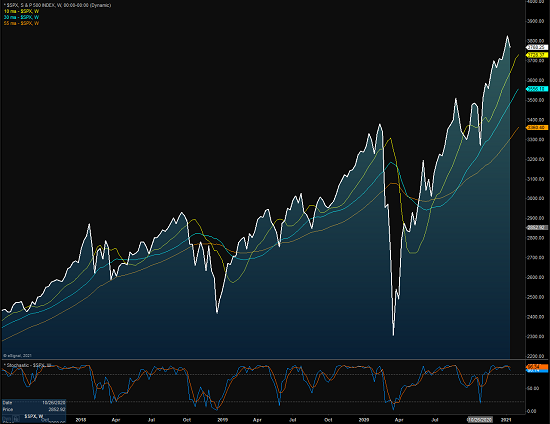
The Cyclical Market Cycle
Below is a weekly chart of the S&P 500 illustrating the current cycle, which we estimate began on March 24, 2020.
S&P 500 - Weekly
Thought for the Day:
A lie gets around the world 30 times before the truth even gets its boots on. -Donald Rumsfeld
The opinions and forecasts expressed herein are those of Mr. David Moenning and may not actually come to pass. Mr. Moenning's opinions and viewpoints regarding the future of the markets should ...
more

