
The Yield Curve Is Now Irrelevant
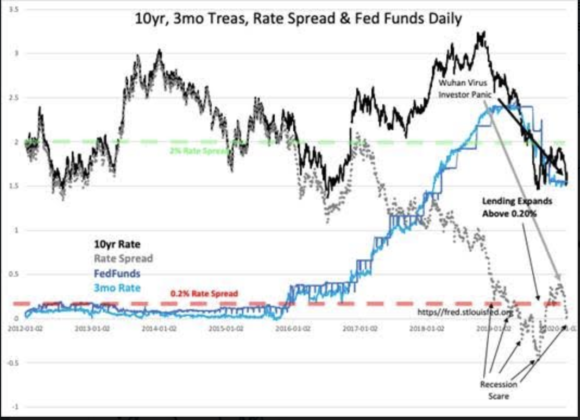
The Wuhan Virus scare is the 5th Recession scare since late 2018. This can be seen in the T-Bill/10yr Treasury rate spread as it dips below 0.20% and then goes negative producing an inverted yield curve. The history of this rate spread since 1953 predicting economic slowing has made this a key indicator for investors due to being a proxy of net interest margins at banks and the pace of lending activity. Slowing lending activity has in the past always resulted in slowing economic activity and often enough economic activity slipped into a recession. With the emergence of high-speed computerized trading to be first to market when a market signal has been triggered, algorithms of all types are now in use to operate buy/sell programs on swaths of issues to execute trading instructions at a pace well beyond human abilities in past market cycles.
The issue at hand in the current cycle is that markets never repeat. The economic, technological, geopolitical and policy context of markets evolve with our perceptions making every day slightly different from the day prior. Being part of this evolving context, we focus on the details of the day and become insensitive to the changes on a larger scale. We lose track that the conditions which led to the usefulness of indicators over time may not hold today. Such has occurred with yield spread indicators. The conditions of the past which made the yield curve useful as an economic indicator are not operating today.
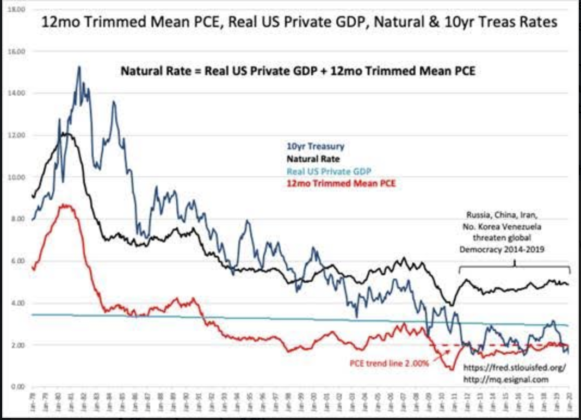
Two significant differences involve changes to the banking industry and the globalization of investment markets. Globalization of markets since the 1990s has created many markets today not in existence 20yrs ago with capital of the largest markets now allocated throughout global opportunities large and small. This has accelerated global capital flows in both directions. As emerging markets gained liquidity, we began to witness falling rates in Western markets as owners of these newly public companies diversified into markets they viewed as safer havens. Sovereign Debt rates fell eventually to 5,000yr lows with several even turning negative in recent years. In the US, the Natural Rate, a fundamental measure of market capitalization based on Knut Wicksell’s economic observations from 1898, reveals that capital flows began to impact 10yr Treasury rates in 2001. The 10yr rates had till 2001 remained above the Natural Rate. Since then 10yr rates slipped progressively lower from the Natural Rate. Rate structures which historically represented capital flows within one’s own markets with known economic impacts now reflect an entirely different set of global criteria. Today, this results in a 10yr Treasury rate of ~1.6% vs. the Natural Rate of ~5%. Today, every foreign political/economic scare drives the US$(US Dollar) higher and the 10yr Treasury rate lower. A persistent misperception in Western markets is the belief that Central Bankers have forced rates into negative territory with investors acting self-destructive. Not so! This is the action of foreign capital seeking safe havens away from deteriorating domestic situations. Shifting to markets even with negative rates makes sense when one’s own currency is collapsing relative to where one has parked capital. Many solely focused on their own markets have missed the benefits safe havens bring to investors outside long-established systems with well-known property protections.
The US banking system used to set lending rates vs. US Treasury rates. As Treasury rates fell persistently below what was deemed economically viable, banks instead turned to relying on higher market rates, i.e. typical business lending rates range 5%+. Banks have also shifted revenue generation away from net interest margins towards fee-for-service. While narrowing of the yield curve does lower net income margins, the impact on lending is far less today than in the past. A series of 4Q19 reporting by the banking sector underline how little the impact they have experienced from recent yield curve inversions.
The investment context used by trading algorithms are based on a historical view of the yield curve in a mostly closed system. Our market is now wide-open globally. The yield curve is no longer a relevant indicator! In previous inversions, how it occurred was an important feature. Previous inversions occurred within a rising rate context representing the shift of capital towards equity. The shift in rates higher represented rising investor optimism. As optimism became dominant, rising 10yr rates were followed by rising T-Bill rates. At extreme optimism, the fear of missing out(FOMO) saw T-Bill rates exceeded that of the 10yr. Market tops prior to current conditions represented peak optimism(often rampant speculation) at the point of yield curve inversion. The slowdown in lending and economic correction which followed served to be that nail-in-the-coffin for that market cycle. With markets being global, the yield curve no longer serves as a useful signal.
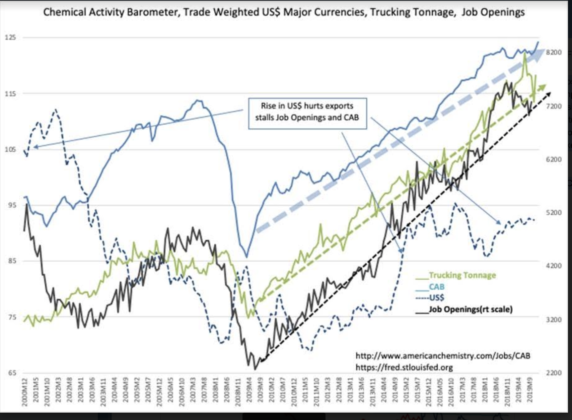
The better market signals represent hard measures of economic activity, i.e. Chemical Activity Barometer(CAB), Trucking Tonnage Index(TTI), Employment, Personal Income, Retail Sales and etc.
Disclosure: The information in this blog post represents my own opinions and does not contain a recommendation for any particular security or investment. I or my affiliates may hold positions or ...
more

