
The Yield Curve Has Dis-Inverted. Are We Safe Now?
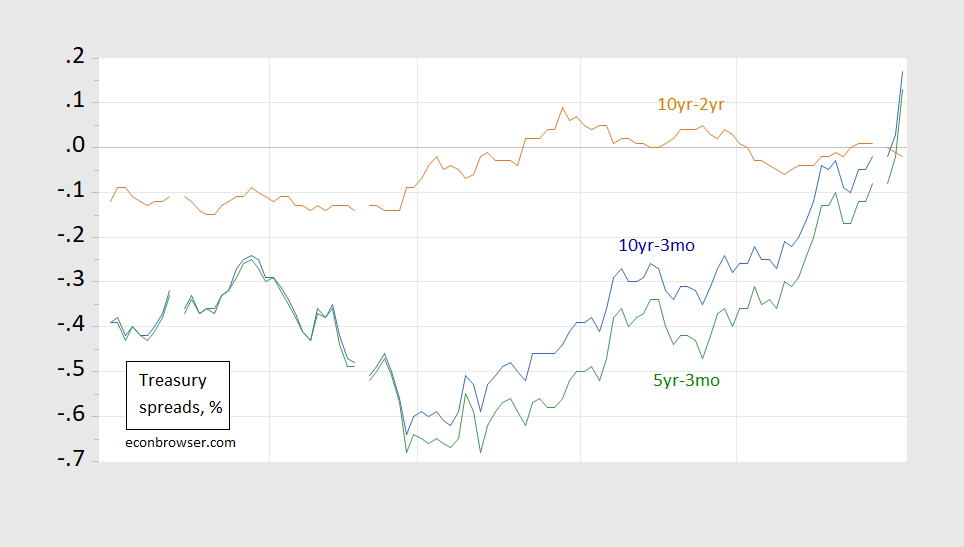
Figure 1: 10 year-3 month constant maturity Treasury spreads (blue), 10 year-2 year (red), 5 year-3 month (green), in %. Source: Federal Reserve, Treasury.
Maybe not…Here’s the same graph with the dates:
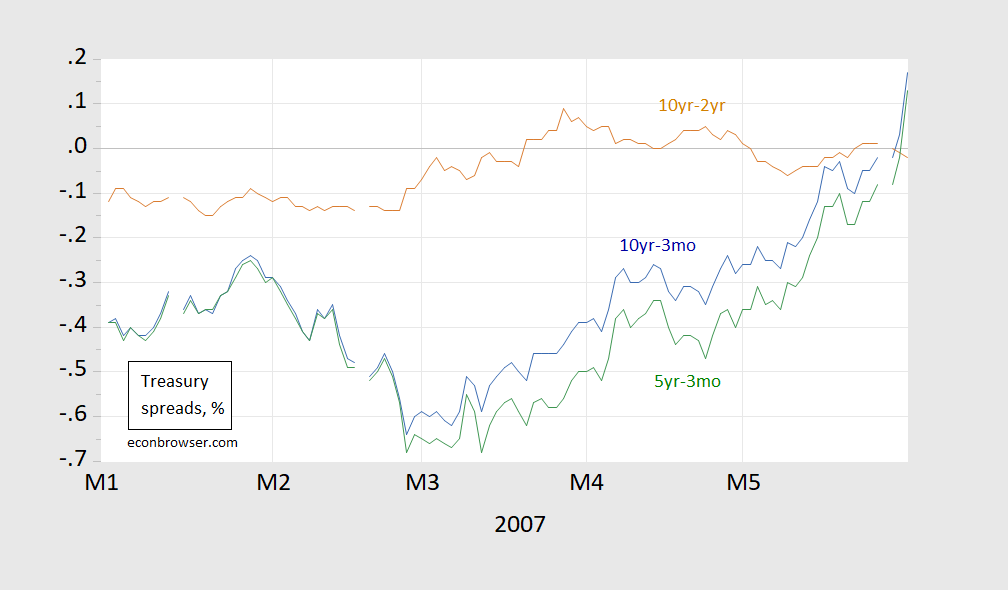
Figure 2: 10 year-3 month constant maturity Treasury spreads (blue), 10 year-2 year (red), 5 year-3 month (green), in %. Source: Federal Reserve, Treasury.
The recession began (as dated by NBER) in December 2007.
What does the current situation look like?
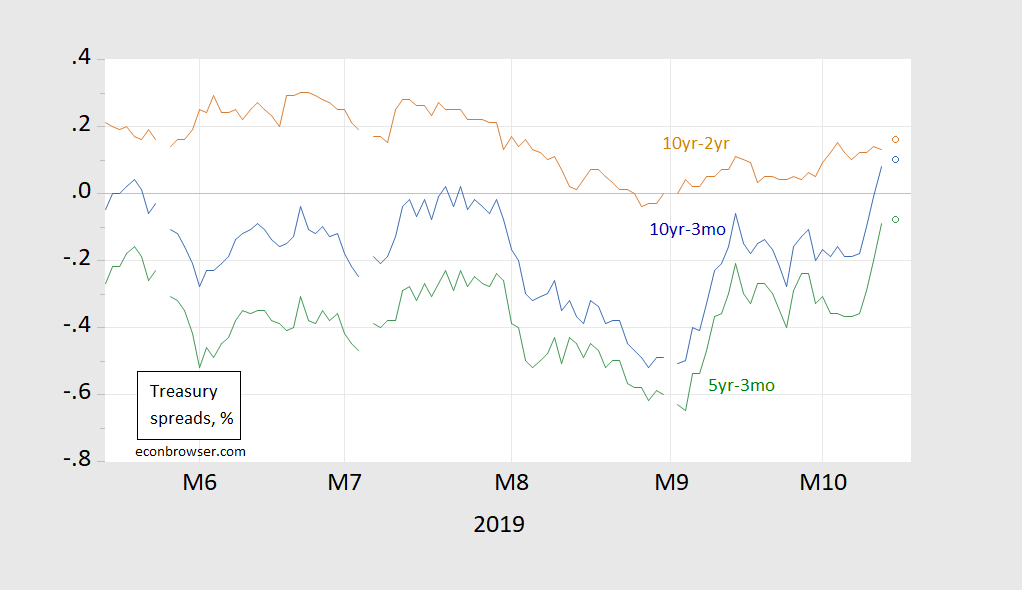
Figure 3: 10 year-3 month constant maturity Treasury spreads (blue), 10 year-2 year (red), 5 year-3 month (green), in %. Source: Federal Reserve, Treasury.
Disclosure: None.
How did you like this article? Let us know so we can better customize your reading experience.

Comments
Leave a comment to automatically be entered into
our contest to win a free Echo Show.

