
The Yield Curve And Recessions: Against U.S. - Centricism
by Philip Pilkington
One of the nicest stylized facts in applied economics is that if the Fed inverts the yield curve it will cause a recession. Inverting the yield curve basically means that the Fed hikes the short-term interest rate goes higher than the long-term interest rate. In theory this should lead to long-term lending drying up, investment falling significantly (usually in housing and inventories) and, ultimately, a recession.

The track record of this as an indicator of recessions in the US is too impressive to dismiss. Take a look at the chart below. The shaded areas are recessions. As you can see, every time the short-term interest rate (blue line) climbs about the long-term interest rate (red line) we see a recession within around 12 months or so.
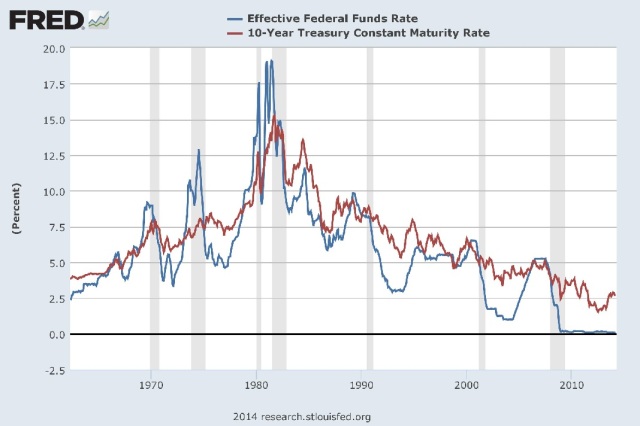
The question, however, is whether this is universal economic constant. And when we turn to the data from other countries we quickly see that it is not.
All the data that follows if from the St. Louis Fed but I have done the graphs myself so that I could include lines indicating British and Japanese recessions.
Okay, so let’s take the UK first. This graph is pretty rough but the green lines are the starts of recessions and the thinner black lines are points when the short-term interest rate rose above the long-term interest rate without causing a recession. The short-term interest rate is the blue line and the long-term interest rate is the red line.
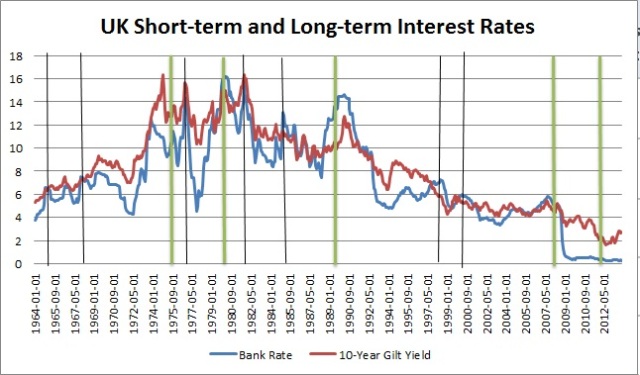
As we can see, the story here is a bit more complicated than in the US. Only three out of the five recessions were precipitated by an inverted yield curve. Meanwhile the yield curve inverted seven times without causing a recession.
This does not bode well for the notion that this correlation might be constant across time and space.
So, let’s turn to Japan. Unfortunately, the data available for Japan is only from during the so-called Lost (Two) Decade(s) and so we will be dealing with a rather unusual period. Nevertheless, it should still prove interesting.
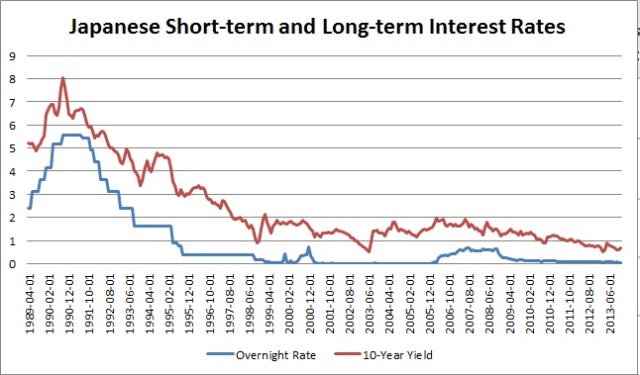
As the reader can see I have not bothered to mark the recessions in this chart. Why? Because it is quite clear that the yield curve never inverted in this period. The short-term interest rate (blue) always stayed below the long-term interest rate (red). What’s more, in this period Japan had five recessions. Including a massive one at the beginning of the 1990s. Clearly these were not correlated with and therefore not caused by an inverted yield curve.
So, the question remains: why is this correlation so strong in the US? This is impossible to answer without some doubt but allow me to shoot from the hip a little and throw out some potential causes. (Suggestions welcome in the comments!)
- The US is a very insulated economy: due to this recessions are caused largely by internal factors.
- The US economy is more credit-driven than other economies: hence, the interest rate plays a larger role in investment and consumption decisions.
- The US has tended to use monetary policy more consistently than its neighbors: which is why the economy has become more ‘used’ to falling into recession when monetary policy is aggressively tightened.
- There is a self-fulfilling belief in the US that an inverted yield curve leads to recessions.
Frankly, I think that the answer lies somewhere in between the four reasons listed above. I think that reason number four is also probably the most important. Folks in the US get very hot and bothered about inverted yield curves — reflecting the American love for projecting engineering-like causality into just about every field — and this likely has a sort of ‘self-fulfilling prophecy’ effect.
Anyway, whatever the reason the facts are clear: the rule-of-thumb that a recession will generally follow on the back of an inverted yield curve is a good one for the US — whether it is based on hocus pocus or otherwise — but it is probably useless to apply outside of the US. Once again we learn that time-tested lesson: there are no universal laws in that all-too historical field known as economics.
Update: Mark Sadowski has linked to an interesting BIS paper in the comment section entitled Does the Term Structure Predict Recessions? The International Evidence. It provides a very nice table of the probability of having a recession four quarters ahead of interest rate hikes.
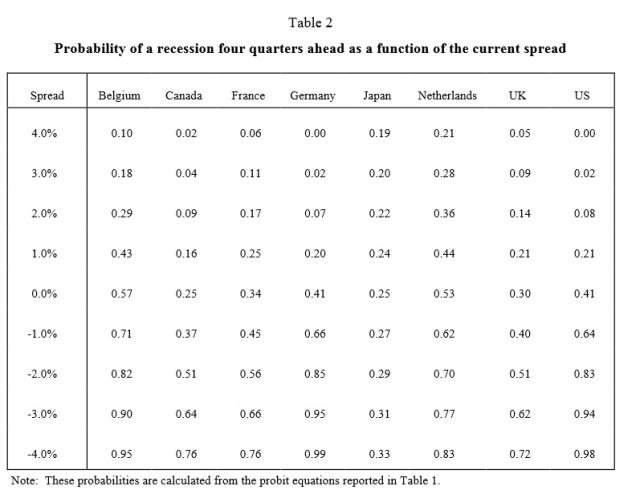
The authors explain how to interpret this table as such,
To interpret the results in Table 2, consider first the case of Germany, the country for which the predictive power of the spread appears the strongest. Suppose first that long interest rates are 4% above short interest rates, so that the spread is 4%. The table indicates that the probability that a recession will occur in four quarters’ time is 0%. However, as short rates rise relative to long rates, the probability of a recession increases as well. Thus, when the spread is 2%, the probability is 7%, and when the spread is 0% the probability is 41%. Note, furthermore, that as the spread turns increasingly negative the probabilities rise quickly. When short rates are 1% above long rates, the probability of a recession rises to 66%. When the spread is -2%, the probability is 85%. Finally, at a spread of -4% the probability that the economy will be in a recession in four quarters is 99%. (p10)
I think that the results of this study pretty much confirm what I said in the above piece: the relationship between an inverted yield curve and recessions in the UK and Japan is not as solid as in the US and should be treated with caution (in Japan’s case, with extreme caution).
Beyond that, one or two more comments. Germany seems to be another country, ala the US, where the relationship holds. I am somewhat suspect of the Belgian and Dutch data because all the data was taken from the years 1972-1993. In 14 of these 21 years the Belgian franc and the Dutch guilder were pegged to the Deutschmark under the ERM arrangement. So too was the French franc, but given that France is a bigger country we do not see quite as much of a pass-through effect. Finally, the Canadian data confirms my view that we should treat inverted yield curves with a bit more care than they are usually treated.
Disclaimer: No content is to be construed as investment advise and all content is provided for informational purposes only. The reader is solely responsible for determining whether any ...
more

