
The Streak Ends For Jobless Claims
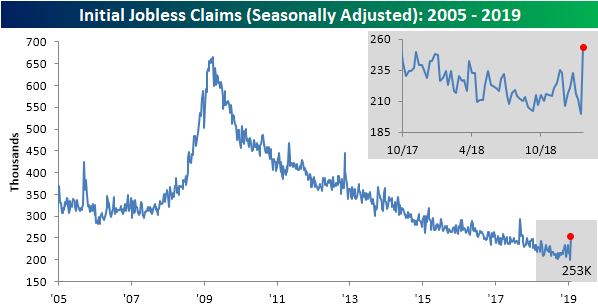
This morning’s release of Initial Jobless Claims seems to have made an about-face from the impressively strong reading of 199K seen last week. On a seasonally adjusted basis, claims for this week not only went back above 200K but skyrocketed all the way to 253K; their highest level since September 2017. This week’s number also far surpasses the recent jumps seen in October and November of last year when they rose to around 230K. This spike in claims brings an end to the streak of 68 weeks with the seasonally adjusted number coming in below 250K. That was the longest streak since the 89-week streak that ended in January of 1970. Granted, the indicator still has 47K of insurance in its streak of remaining under 300K. That streak is now at 204 weeks long, so while this week’s data raises an eyebrow, it still maintains a healthy level.
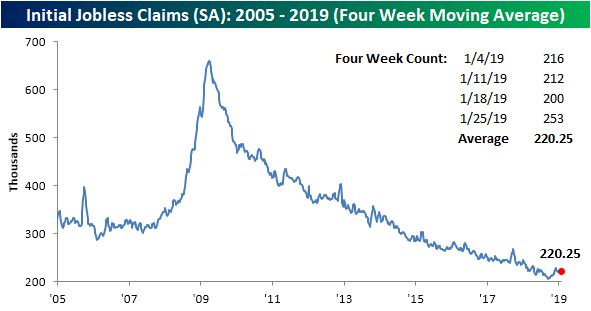
Give the large spike in claims, the four-week moving average also rose with a 5K uptick this week to 220.25K. That is right back in line to where the moving average was back in November and December. With the large reading from this week staying in as an input to the average, it will probably remain somewhat elevated for the time being.
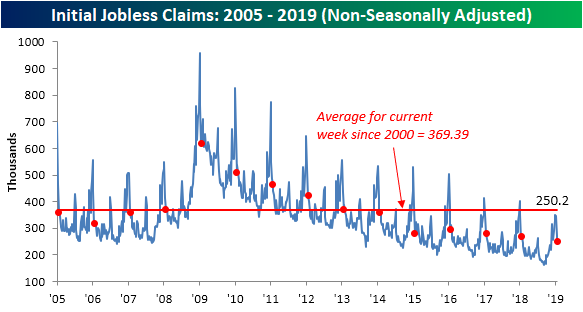
Turning to the non-seasonally adjusted (NSA) data, believe it or not, claims actually fell by almost 20K. The NSA number for this week was 250.2K versus 269.8K last week. Once again, that is well below the average for the current week since 2000 and the lowest reading for the current week in that same timeframe. While the seasonally adjusted number may have come in exceptionally high, labor markets still seem healthy through this non-seasonally adjusted number. The large divergence between the SA and NSA data could very well come as a result of certain quirks in the SA calculations. Also important to note, the government shutdown should not play too large of a role in these readings as government workers are supposed to apply for jobless benefits through other programs, meaning they would more than likely not be counted in these initial jobless claims numbers (although contractors impacted by the shutdown may have started to show in the numbers)
Disclaimer: To begin receiving both our technical and fundamental analysis of the natural gas market on a daily basis, and view our various models breaking down weather by natural gas demand ...
more

