
The S&P 500 Just Did What?
This week lets take a look at the SPX from a longer term two year time frame so as to give us a clue as to what could be on the horizon.
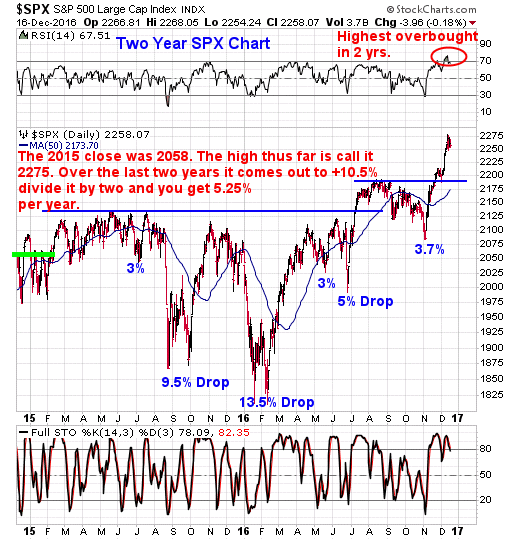
The 2015 close was 2058. The high thus far is call it 2275. Over the last two years it comes out to a +10.5%. return. Now divide it by two and you get 5.25% per year. Nothing wrong with that.
However, and this is just food for thought. Look what type of wild swings one had to endure to get that buy and hold return.
Next up here is what I want you to really observe. While up 10.5% over the last two years take a look at what its done since the November Election lows. Yes, another beeline don't blink move right up that put on about 9.1%
That is virtually all of the last two years worth of gains came in the last two month time frame. How crazy is that.
Now lets take a look back to the end of 2014 with this index.
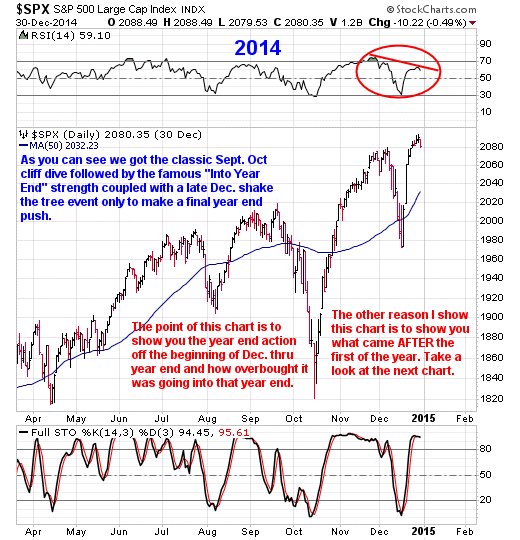
The point of this chart is to show you the year end action off the beginning of Dec. through year end 2014 and just like now, how overbought it was going into year end.
Now lets take a look at what occurred after the 1st of the year.
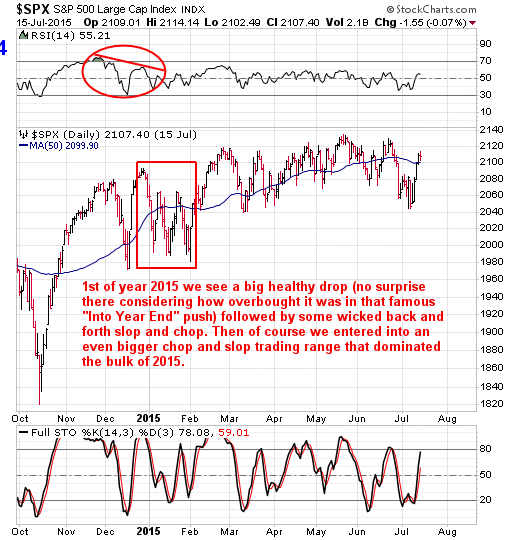
My point is, at the least expect a healthy pullback 1st of the year if we don't get one before hand. If you ever needed a reason to scale back some percentage of your holdings what I've just shown you should set it home as to a good reason why getting out while the getting is good for awhile isn't exactly a bad thing to consider with a portion of ones holdings.
Getting back to the two year SPX chart for a moment, Given the wicked gyrations over the last two years (par for the course in a mature bull market) it lends credence to being more of a swing trader long and short going forward for a bit.After all, as you've seen it really hasn't been a cake walk when all said and done the last two years, actually extremely volatile.
All of which leads me to a game plan one may want to consider going forward or at the least some food for personal thought is that of the power of $500 per week as a potential game plan in the short term.
First off, what is $500 in a weeks worth of time?Well its 100 shares to move 5 points, 250 shares to move 2 points in ones favor and so on. I think you get the point.
Now lets say we only do 4 trades a month. That's it, just 4 trades a month.What is 4 trades a month with a $500 gain? Its 2000 per month, times 12 months is $24,000 per year. On a 100,000 portfolio that's a 24% return in a perfect world.
On a 50,000 portfolio scale it down to 4 trades per month with a game plan of looking for a $250 gain per trade.
Now here is the thing so pay close attention to this. There is no need to have to be fully invested. Think about that for a moment. 4 trades a month! Just 4 lousy trades per month! Folks, that's just 1 decent trade per week when you think about it
Now keep in mind that is in a perfect world of no losers and a we all know there isn't a person on the planet who has ever hit 18 holes in 1 and there never will be, hence there will be times, good times, bad times and just so times, folks that's just life if you think about it.Regardless of all of the above, one still needs to have a game plan to guide them by right? So for those looking for one, the above may just be one of them to consider.
As I've just shown you, in a perfect world its a way to show a 24% return over the course of the year. Heck even half of that is 12% in the course of a year. Say, what has the SPX done over the last two years as we've just seen? Its taken two years to show a 10.5% with the bulk of it the last two months that's what. Personally, I seriously doubt the SPX does 12% in 2017, especially after its just ran 200 points or almost 10% in two months!
As far as no need to be fully invested goes another thing to keep in mind is that of a lot can be said for a high cash position folks, it provides a serious sense of security not mention piece of mind and a low stress level. What's not to like about that right?
Let's also not forget that this current bull market cycle is 8 or so years old and as far as time duration from a historical perspective its in the top five of all time if I'm not mistaken, if that's not mature and long in the tooth I don't know what is.
Lastly, also given the extended nature of the indexes and many names that have staged don't blink reactionary moves to the upside in post election trade based upon a future expectation? I am starting to see more short sell patterns setting up in here too. I've started to show a few in the premium newsletter setting up already and will have more to follow this week.
Disclosure: None.
Disclaimer: THESE ARE NOT BUY RECOMMENDATIONS! Comments contained in the body of this ...
more

