
The Short Squeeze: Another Failed Reality Check For The Markets

With last week’s historic short squeeze by retail traders appearing to taper off, the wave of buying euphoria that had prevailed in early January is now returning into the markets.
Analysts in the media continue to discuss the “strong” gains claimed by the market in 2021, using the familiar yardsticks of the S&P 500, Nasdaq Composite, and others.
For many years at Dohmen Capital Research, we have highlighted the dangers of placing too much emphasis on the widely-watched large-cap stock indices. Most investors don’t realize just how easy it is for institutions to manipulate the prices of a few key stocks to give the public the impression that the stock market is much stronger than it is.
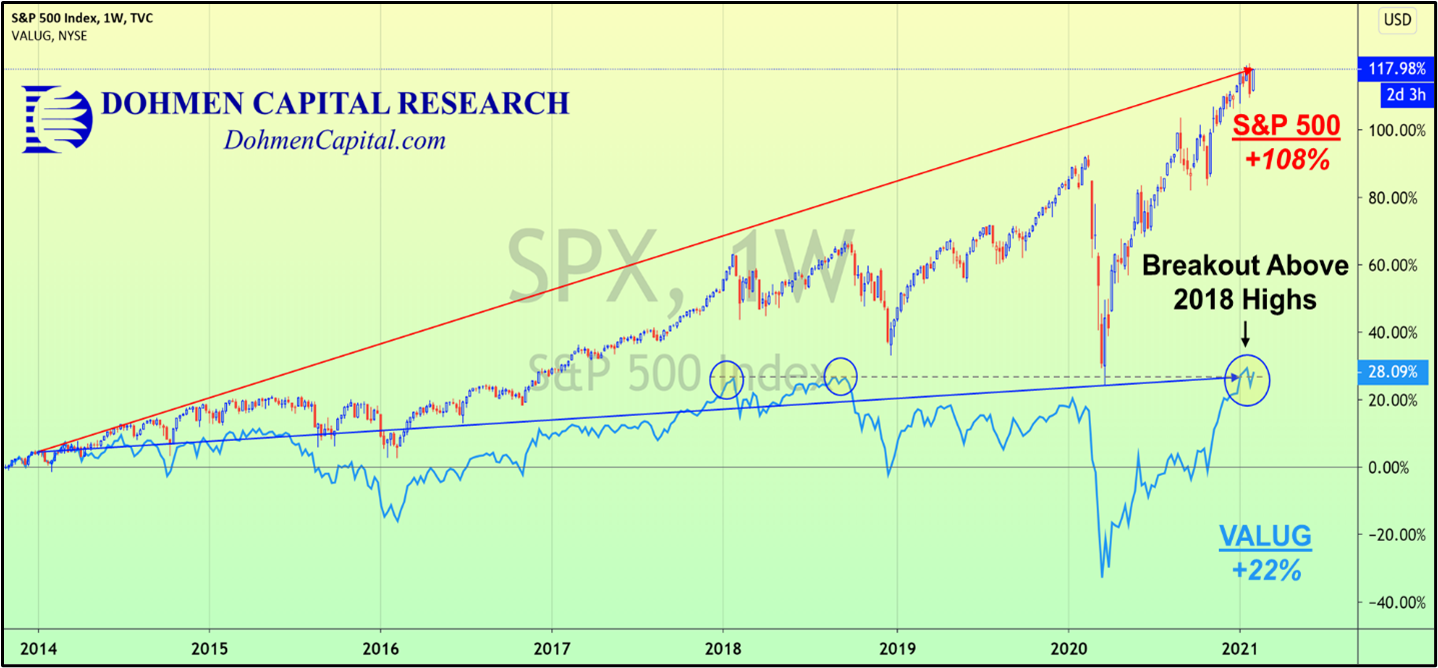
The S&P 500, which is primarily driven by the performance of only a dozen or so mega-cap stocks, has gained nearly 107% since the beginning of 2014, an impressive figure. The VALUG, however, which weighs over 1600 stocks equally, and in our view is much more representative of the market’s true performance, only gained a measly 21% over the same period.
On the chart below, we can see that the VALUG, after recently breaking above its 2018 highs, has since turned lower:
Because the VALUG is comprised of many more stocks and gives smaller companies and larger companies equal weighting, it is also tied more directly with economic conditions than the S&P 500.
In fact, the VALUG’s growth is much closer to the U.S.’s real GDP growth of around 2% per year since 2014. It indicates that the vast divergence between the S&P 500 and VALUG above is the result of inflated valuations in the popular larger cap stocks, not earnings growth.
When the impact of the pandemic eventually passes and the economy returns to normal, what will investors do when companies are unable to justify their lofty valuations with better profits?
Here is a great chart that shows how overextended stocks are, versus the underlying reality: It shows that the S&P 500 growth (orange line) is now 8x times GDP growth (purple line) and 3x corporate sales growth (blue line). Economists always tell us that the stock market reflects economic growth. That’s precisely why we don’t listen to economists (chart via Real Investment Advice):

Eventually, reality returns and the excesses in the stock market will be wiped out, just as they were during the last two bear markets.
However, there is one critical difference between the current environment and previous periods of investor overexuberance. We discussed this important factor in our latest Wellington Letter:
… global central banks have created a record $19 TRILLION of artificial liquidity. This staggers the imagination. Stimulus used to be measured in terms of billions of dollars. A trillion is 1,000 times larger than a billion.
No one can “know” how long the stimulative effect will last, or what happens when it fades away. Why is it that if the markets and the economy are supposedly in good shape, Washington is eager to inject another $2 TRILLION into the system, followed by even more to come?…
…Obviously, the Fed’s actions have injected a lot of debt and debt guarantees. As we have written for years, that creates more demand, but it moves future demand into the present. Someday, the big demand hole thus created in the future will cause a great recession or depression.
The Fed will try to prevent that with even more stimulus, but eventually that will result in high inflation with no real economic growth. That is always the limitation of Fed policy. That is what we have to watch for down the road.
Given the inflationary risks, perhaps it is no surprise that inflation hedges like gold and silver made important highs in 2020 and have a good chance of surpassing these highs in 2021.
In the long-term, we can expect the huge stimulus actions by the government to continue propping up the markets, though it will not continue forever. Determining the market’s trajectory over the short term, however, requires a different type of analysis.
Identifying key turning points for the market involves a keen eye for market sentiment as well as a good understanding of advanced technical analysis. For over 45 years, we have successfully used these to identify critical turning points in the markets. The S&P 500 chart below shows just some of our accurate calls since 2018:

Our elite group of members were able to position their own investments ahead of these major market moves to the upside and ahead of the big declines. In our award-winning Wellington Letter, we ...
more

