
The Secret Appeal To Shorting VIX
As many die-hard VIX sellers already know, it is very possible to make money with short VIX positions without any significant movement at all in the VIX. In this article, we will briefly explain the factors that go into this. If you have not read Greg King's previous article on shorting VIX, we would recommend you do so before reading this one.
Taking the period of time since January 3, the first trading day of 2017 to March 16, (the day of this writing), we see this phenomenon at work. During that time, the VIX index moved from 12.85 to 11.21 while hitting a high of 12.85 and a low of 10.58 during the period. Overall, the net move was -12.76% and the distance between the low and the high as measured from the starting level of VIX for the period was 18.1%.
So even if someone picked the high to short VIX and the low to buy it back, timing the market perfectly, the maximum return would have been +18.1%. Now keep in mind VIX is uninvestable as is, and that does not factor in transaction costs.
However, during that same time frame, a hypothetical static short position in continuously rolling VIX futures, as represented by the S&P 500 VIX Short-Term Futures Index would have gained a staggering +31.99%.
Moreover, a daily compounding position in shorter duration VIX futures contracts, as represented by the returns on the net asset value of the REX VolMAXX Short VIX Weekly Futures Strategy ETF (NYSEMKT:VMIN), would have gained 47.47% over this same time frame (note: past performance is certainly no guarantee of future results, with respect to the VIX, VIX futures, or VMIN). Still how is it possible that short VIX futures positions have risen more than the level of the VIX has fallen? Spoiler Alert: The answer lies in the steepness of the VIX futures curve.
Let's remember that a short position in futures of any kind has three potential sources of return. First, is the most boring. Collateral yield. Futures are leverage instruments, and so the cash collateral supporting them must have a yield to it. Ten years ago, this made a lot more of a difference than it does today because rates were higher, but it still counts for something.
A second source of return is the movements in the underlying index itself (in this case VIX). How the VIX moves up and down affects the corresponding prices of the VIX futures. And even though it may seem like a foregone conclusion that up movements in the VIX equate to up movements in the VIX futures, that may not always be the case, although most of the time it is.
Which leads us to our third source of returns, roll yield. This last source is what tends to confuse investors the most. Holding a position for a time period longer than the duration of the underlying futures contract means the position must be rolled. For example, before April expiry, an April VIX contract that has been sold short must be bought back and the May VIX contract sold in order to maintain the short position. Through this contract swapping process, a profit or loss is achieved.
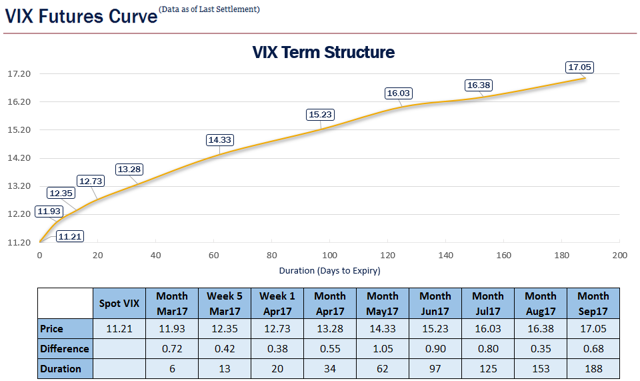
The above graph shows the VIX futures curve as of the close on March 16, 2017; we can see that the March, April, and May prices are 11.93, 13.28, and 14.33 respectively. Let's assume the curve were to stay the same shape over time and that the level of the VIX does not move.
If we assume the April contract (now at 13.28) follows the curve down, and in a month, closes where the March futures contract is now (at 11.93), that short position would increase by the difference (1.35 or around 10.17% on the shorted notional). The punch line here is that, given our assumptions, spot VIX has not moved but value of the short VIX futures position would have increased by 10.17% in one month.
This is the secret appeal to shorting VIX. The steepness of the curve lately has rewarded short position holders handsomely, even though VIX has not moved much. Although they are bearing the risk of VIX rallying unexpectedly (a significant one), many still choose to employ this strategy. And now you know why.
Footnotes
- The market price return for VMIN is 47.26% for the same period. NAV return for VMIN from inception (5/2/16) to 12/31/2016 was 81.24%, and the market price return for VMIN was 81.08% for the same period. The fund's expense ratio is 1.45%. Past performance does not guarantee future results. Performance quoted represents past performance, which is no guarantee of future results. Investment return and principal value will fluctuate so you may have a gain or loss when shares are sold. Current performance may be higher or lower than that quoted. Short-term performance is not a good indication of the fund's future performance, and an investment should not be made based solely on returns. Shares are bought and sold at market prices and not individually redeemed from the fund. Brokerage commissions will reduce returns. NAV is calculated using prices as of 4:15 PM Eastern Time. The market price is the Mid-Point between the Bid and the Ask price as of the close of the exchange. Market price returns do not represent the returns an investor would receive if shares were traded at other times.
About REX
REX Shares, LLC ("REX") creates intelligently engineered alternatives ETFs that seek to help investors navigate turbulent markets and preserve wealth. REX ...
more

