
The Scott McCreery, “In-Between” Stock Market (And Sentiment Results)
The song we chose this week – to embody the sentiment of the stock market – is Country Star Scott McCreery’s song, “In-Between.”

The lyrics that speak to the recent change we are seeing – as sectors like Tech (Growth) and Healthcare take a breather – and other sectors like Financials and Industrials (Value/Cyclicals) catch a bid (to pick up some of the slack) are:
Ain’t too high isn't too low just holding down the middleI’m steady as I go…
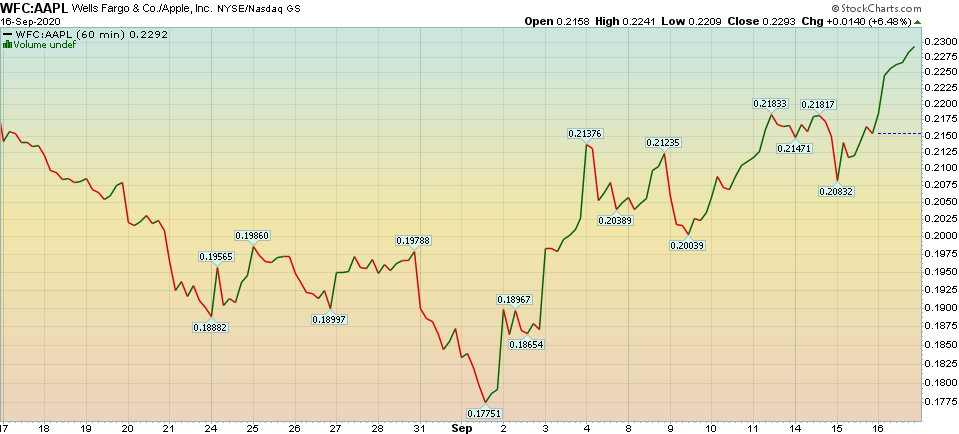
A couple of weeks ago, we laid out the case for the “Most Loved” stock in the S&P 500 (AAPL) being overvalued, and the most hated stock in the S&P 500 (WFC) being undervalued. You can review it here:
The Stevie Wonder, “Faith” Stock Market (and Sentiment Results)…
Right after that note, the tide shifted abruptly. Here is a ratio chart of the performance of WFC:AAPL since:
(Click on image to enlarge)
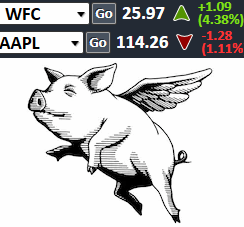
To address the skeptics of my thesis, in the note I said, “I can hear it now, ‘Wells Fargo will begin to outperform Apple on a relative basis – WHEN PIGS FLY…'” Yesterday I tweeted the following – to represent the persistence of this new trend:
On Tuesday, I was on Fox Business (The Claman Countdown) with Liz Claman. Thanks to Ellie Terrett for inviting me on the show. The question posed to me was whether it made sense to buy Tech, or look elsewhere. I addressed a number of findings from the Bank of America Global Fund Manager Survey (that was published on Tuesday morning) and listed the financials we preferred over tech. View it here.
On Monday, I was on Cheddar TV with Brad Smith. Thanks to Francesca Conti for inviting me on the show. I talked about the imminent vaccine as a catalyst for the rotation into cyclicals, and went into granular detail about one key factor in our Banks thesis – CECL. CECL – which stands for “Current Expected Credit Loss” is an accounting change that went into effect in Q2 2020 – which made the banks’ results look much worse than they actually were/are. Watch this segment to learn the specifics.
The key takeaway is that the “Big 4” banks reported ~$5B in pre-tax income for Q2 2020 versus ~$34B in 2019. That looks BAD, and that’s one of the key reasons banks were pummeled in Q2.
HOWEVER, if you take away the “paper change” of CECL and compare APPLES to APPLES with the 2019 standards, the “Big 4” actually reported $28B in Q2 2020 (a year on year decline of $6B NOT $29B). Not bad considering we shut down the world for several months.
And the kicker? The “Over-Reserved” banks will start to reverse those excess reserves (~$23B worth – as they took $28B of reserves in Q2 2020 versus $5B in Q2 2019 – due to CECL) in coming quarters and years. These reversals will come back as income (Earnings) moving forward.
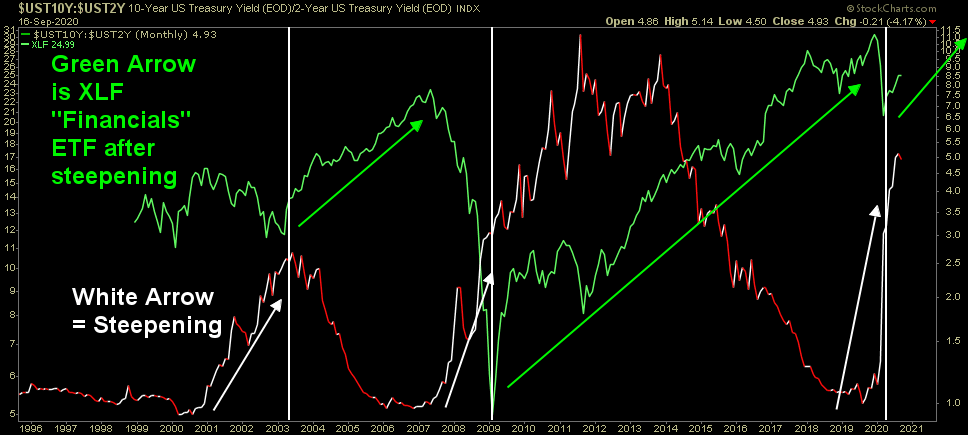
While everyone is focused on the Fed keeping short rates low for the next three years, they miss the forest for the trees – as the yield curve continues to steepen. This will begin to improve NIM (net interest margin) for banks over time. It works EVERY single cycle:
(Click on image to enlarge)
Just today, the Fed took their 2020 GDP estimates up to -3.7%. Remember when the IMF came out in June with -9% 2020 GDP expectations for the US? Never bet against America…
No Pain, No Gain
For everyone who was skeptical about the rotation, it’s happening now. While it can be a bit painful in the short term for those who are overweight TECH, it is very healthy in the long term (for the general market) as the rally broadens and laggards start to participate (and outperform on a relative basis). Here’s the recent pain in FAANGM:
(Click on image to enlarge)
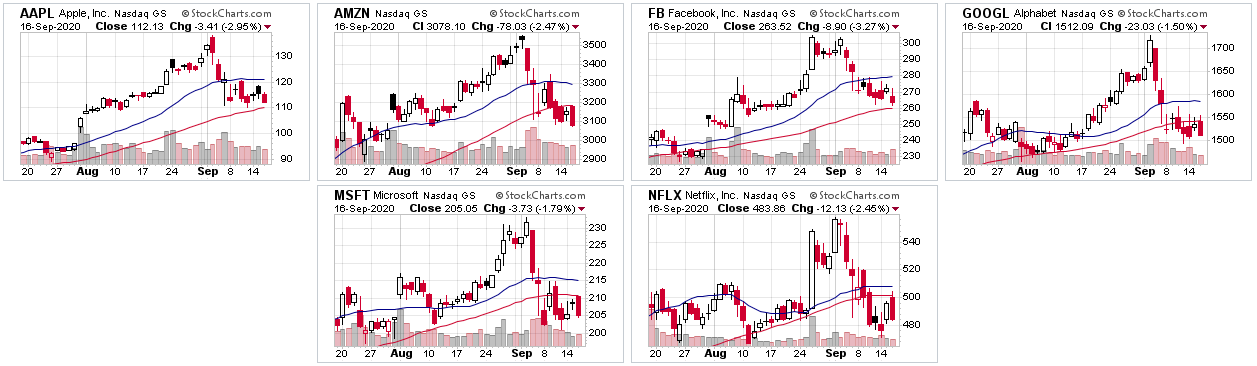
With ominous anti-trust winds swirling around Washington, it may get worse for this small cluster (and several others in the sector) before it gets better. Time will tell…
What the Big Money is Doing
On Tuesday, we put out a summary of the September Bank of America Global Fund Manager Survey. This month ~224 managers running >$600B AUM participated. You can find it here:
September Bank of America Global Fund Manager Survey Results (Summary)
The key findings were as follows:
There is still some skepticism (Wall of Worry to Climb):
- 29% of respondents (down from 35%) still believe it’s a bear market rally.
- 61% of respondents predict U- or W-shaped recovery.
- 20% say V-shaped recovery.
- Cash levels rose from 4.6% to 4.8% (greed <4%, fear >5%).
- Net 18% of investors are overweight equities, but far from “dangerously bullish.”
They are rotating out of technology:
- 80% believe “Long US Tech” most crowded trade of all time (up from 59% in August). OF NOTE: 1-month return reversal occurs after “peak crowded trade” in 14/22 months in past decade.
- Michael Hartnett (BofA), said fund managers signaled that they are “paranoid tech” and have been decreasing their allocation to the sector in favor of more cyclical equities, such as cheaper value shares, small-caps and industrials.
- Survey shows switch into cyclicals, out of tech.
- Rotation continues: tech, healthcare, large cap longs trimmed.
- Industrials at highest overweight since Jan’18.
- Flows to small cap & value up.
Yield Curve:
- 41% say credible COVID-19 vaccine most likely trigger for higher bond yields. This will help NIM (Net Interest Margin) for banks.
- 37% say Inflation most likely trigger for higher bond yields.
The Rotation Makes Sense…
As I mentioned on Liz Claman’s show, this rotation is consistent with Earnings Expectations for 2021 – as Tech is only going to grow at 1/2 the pace of the S&P 500:
(Click on image to enlarge)
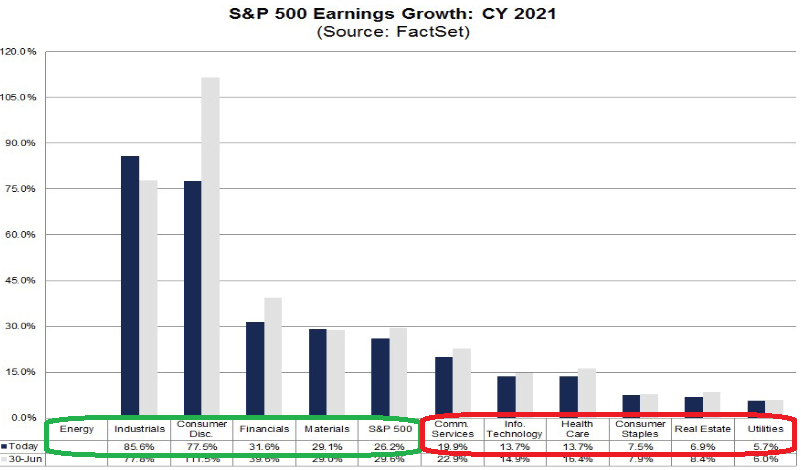
Growth Stocks outperform in a slow-growth economic environment because managers have limited choices where they can buy earnings growth. Tech and healthcare command premium multiples as supply is scarce and demand is plentiful.
In the beginning of a new cycle (we just had the recession with 2 quarters of negative GDP in Q1 and Q2 and are now flying out of it into the new cycle) economically sensitive stocks outperform (Financials, Industrials, Homebuilders, Defense Stocks, Materials, Energy, etc).
Managers begin to have more options to buy earnings growth and turn to better valued options (less money for more earnings). The supply of growing companies expands to match demand so that money is no longer concentrated in just a handful of options. Valuations come down on growth stocks and pick up on value stocks (as money shifts).
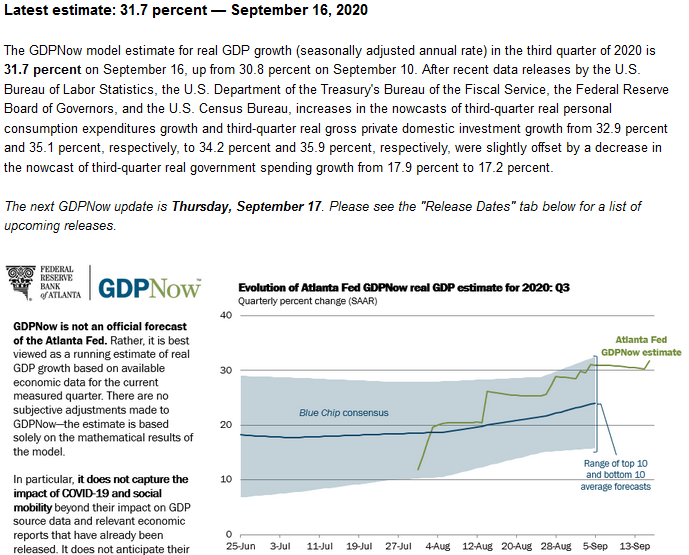
Not only will S&P Earnings grow +26% in 2021, but GDP is projected to be north of +6% (a number we haven’t seen in decades). Furthermore, the Atlanta Fed now has Q3 2020 GDP projected to come in at +31.7%!
So you now have a healthy rotation now taking place, rates will remain low for some time, and the Fed committed to continued asset purchases until they near full employment:
Chairman Powell repeated that the Fed will continue buying Treasuries and mortgage-backed securities “at least at the current pace to sustain smooth market functioning.” They committed to $80 billion of Treasuries per month and $40 billion of mortgage-backed securities.
The Chairman – who had one of the shakiest starts in history – will now likely go down as one of the greatest in history after saving the country from a Great Depression this Spring (along with Secretary Mnuchin, Larry Kudlow and the Administration). They made it look easy, but their performance – in time of crisis – was unparalleled in history. We should all be grateful as the outcome could have been a lot different…
Now onto the shorter-term view for General Market:
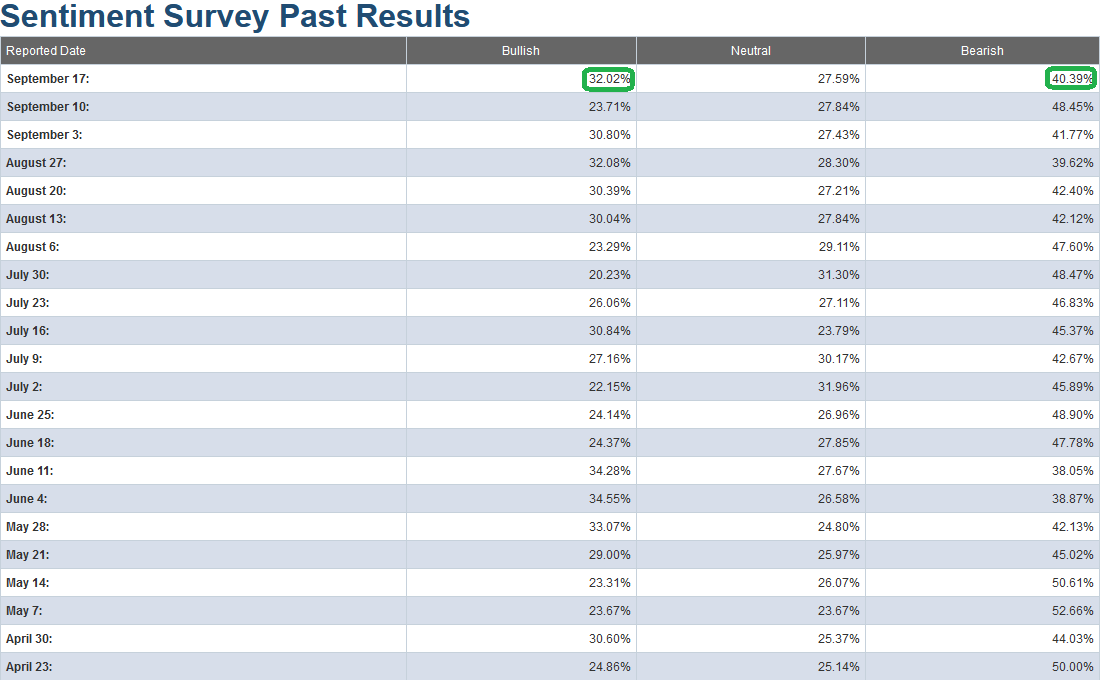
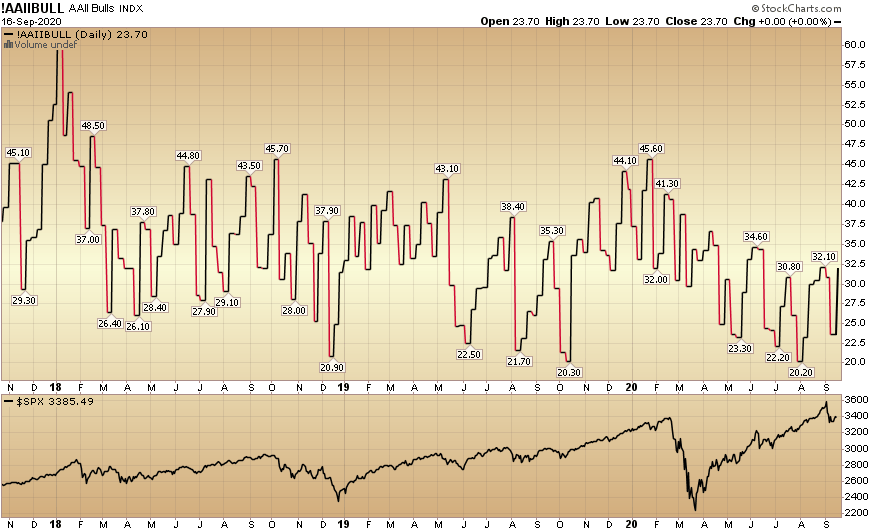
In this week’s AAII Sentiment Survey result, Bullish Percent (Video Explanation) jumped to 32.02% from 23.71% last week. Bearish Percent dropped to 40.39% from 48.45% last week. While optimism creeped in this week, it did not jump to euphoric levels. It is right in the middle of the range…
(Click on image to enlarge)
(Click on image to enlarge)
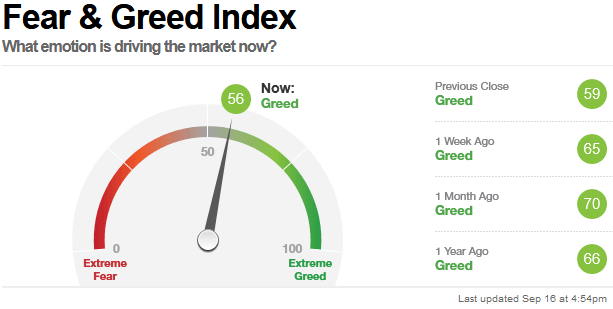
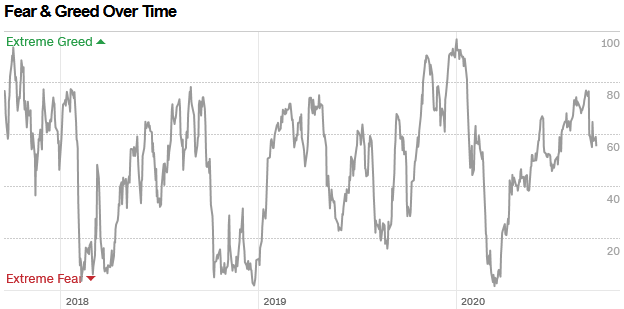
The CNN “Fear and Greed” Index slid from 66 last week to 56 this week. Fear has crept in, but not at an extreme level. This indicator is also in the middle of the range. You can learn how this indicator is calculated and how it works here: (Video Explanation)
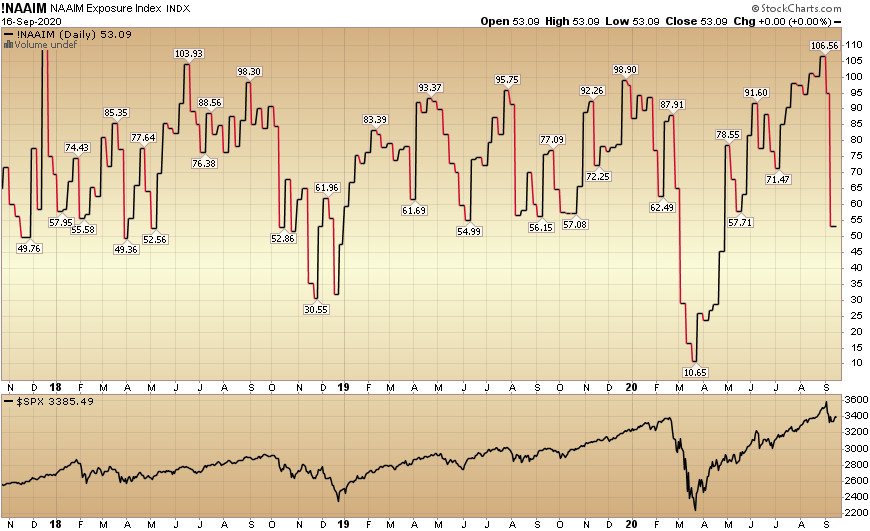
And finally, this week the NAAIM (National Association of Active Investment Managers Index) (Video Explanation) crashed from 94.71% equity exposure last week, to 53.09% this week. A lot of managers were shaken out by the quick drop in AAPL and FAANGM:
(Click on image to enlarge)
Our message for this week:
As I have repeated for a few weeks, the catalyst for change (an abrupt move of money into Cyclicals) will likely come from science at this point. Don’t bet against science.
We now have 9 vaccines in phase 3 and the market is starting to ease into the “re-opening” trade (Cyclicals) – in anticipation of the imminent vaccine approval.
We are in an “in-between” period. Given the overweight to tech, my sense is there is still some more to work out in coming weeks for some of the overvalued pockets of tech/saas, etc. The “pain trade” is still down for some of the “over-owned” names.
However, I do not think we are in for a major wholesale correction. There’s enough money that has yet to broaden their exposure and get positioned for the “re-opening” trade move into cyclicals/value.
These economically sensitive names outperform in the early/high economic growth stages of a new cycle – which we have started in Q3. We will take advantage on any weakness – as opportunity abounds in coming months…
Disclaimer: Not investment advice. For educational purposes only: Learn more at HedgeFundTips.com.


