The Prospects For Negative Rates And The Trajectory Of The S&P 500
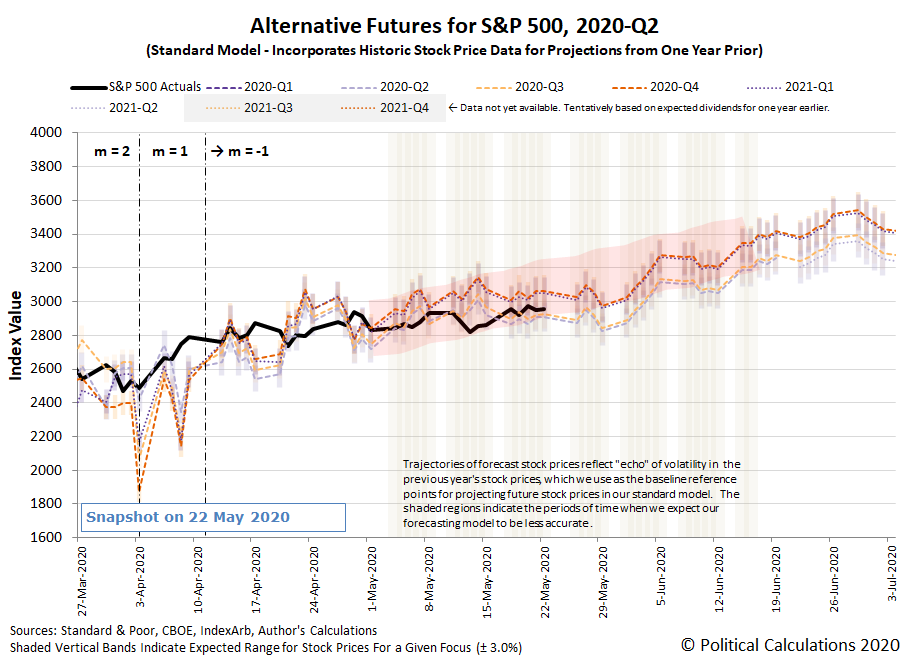
The S&P 500 (Index: SPX) is tracking along the lower end of the redzone forecast range of the alternative futures chart, which assumes investors are looking forward toward 2020-Q4 in setting today's stock prices, and which we suspect also indicates that investors are somewhat backing off the expectation the Fed may institute negative interest rates by that time.

Since the increased potential for negative rates may account for the unprecedented "upside-down" character of how stock prices have been behaving over the last several weeks, we checked in with the CME Group's FedWatch tool to see what it was indicating, where it is currently projecting the Federal Funds Rate will be held at the zero bound range (between 0% and 0.25%) for the indefinate future.

That doesn't mean investors have taken their consideration of negative interest rates in the U.S. off the table. Instead, it means that the CME Group's analysts haven't yet worked out how to adapt its FedWatch Tool to incorporate the possibility of negative rates in its projected probabilities for the future projected level of the Federal Funds Rate. With that limitation, it may be more accurate to read the 100% probabilities the FedWatch Tool is currently indicating as saying that investors are giving 100% odds the Federal Funds Rate being set at the zero bound range or less in the indefinite future.
Now, what if that limitation didn't exist and the FedWatch Tool is capturing that U.S. interest rates will be held at or just above the 0% level? How might that different expectation affect the projections for the S&P 500 provided by the dividend futures-based model?
Assuming that outcome would correspond with the model's amplification factor being set so that m = 0, the following alternative futures chart shows the model's projection of the future for the S&P 500 in that scenario:

In this chart, we assume the shift of the amplification factor, m, to be zero to align with the increased expectation of zero bound interest rates in the U.S. took place beginning on 12 May 2020. We see that shift corresponds with the projected trajectory of the redzone forecast range shifting downward after that point, which corresponds to a less robust path forward for the S&P 500 than under the scenario where investors were factoring in a strong likelihood of negative interest rates prior to that point in time.
It also shifts the redzone forecast in a way that centers it closer to the actual trajectory of the S&P 500 in the period since 12 May 2020 where we've applied these assumptions, though we could also say that the value of the amplification factor m is currently falling somewhere between 0 and -1.
Disclaimer: Materials that are published by Political Calculations can provide visitors with free information and insights regarding the incentives created by the laws and policies described. ...
more


