
The Pound Spikes As Looser Fiscal Policy Eyed
The British Pound was the star performer after the resignation of the British Finance Minister Sajid Javid. Do you want to understand what's the logic behind this move? What about the rise seen in the JPY as US equities keep printing new all-time highs? What factors are influencing this rebound? Keep reading to stay updated on the latest drivers and outlook based on aggregated FX flows.
Quick Take
The British Pound had no rivalry in the Forex land, with the currency finding strong demand after the British Finance Minister Sajid Javid resigned in what was seen as a surprise move. Immediately, the market started to connect the dots, assuming that the successor (Rishi Sunak) will support looser fiscal policy to satisfy UK PM Johnson wishes, and as a result, this may lead to a reduction in the odds for the BOE to cut rates this year. The Yen was the other currency that gained ground with the bulk of the gains seen in Asia as the number of reported coronavirus cases spiked, leading to algo-selling to dominate early doors. The catch, however, is that this spike in numbers won’t be sustained as it was due to change in the standards to measure the disease by the Health Commission for Hubei Province. Nonetheless, it was enough to see the spectacular 7-day bull run in the Chinese market to come to an end and weakness to ensue in the Aussie and the New Zealand Dollar, even if the losses were marginal. The Canadian Dollar was also affected by the selling in carry trades, but the losses were minimal. The USD continues to put up a fight to prevent further downside and as I pointed out when analyzing aggregated flows in the charts section, while the USD valuation is high, the current pullback is the most pronounced seen in 2020, hence counting for further USD weakness is betting on this 2020 pattern to be broken; quite a bold call if you ask me. A currency which just keeps on delivering for the satisfaction of sellers is the Euro, unable to find sufficient buyers to stop the bleeding. Speculation that a dovish shift in rhetoric at the March ECB meeting could be in store amid the slowdown in China’s economic activity is one of the narratives doing the rounds.
(Click on image to enlarge)

Narratives In Financial Markets
* The Information is gathered after scanning top publications including the FT, WSJ, Reuters, Bloomberg, ForexLive, Institutional Bank Research reports.
Virus concerns won’t budge equity bulls: The equity market in the US disregarded the latest news that China's Hubei province reported 14,840 new coronavirus cases. The era of easy money by the Fed is such a unshakable force keeping the record long rally in equities going. Granted, there is a catch in the spike of reported virus cases, which is, the authorities in Hubei revised their diagnostic standard for coronavirus cases. Out of 14,840 new cases, 13,332 were "clinical diagnosis". It is unlikely that this spike in numbers will be sustained after this change in measure by the Health Commission for Hubei Province. The behavior in the Chinese market was different, with the market more spooked by the jump in numbers. For an update on the total count based on ‘official’ numbers, see this link and this one.
Pound traders price looser fiscal policy: The Pound is the stellar performer in the last 24h, as British Finance Minister Sajid Javid resigned in what was seen as a surprise move. The successor (Rishi Sunak) alongside a new team of advisors from No. 10 is seen supporting looser fiscal policy as UK PM Johnson attempts to further cement his grip on power. The higher the expectations for fiscal spending, the less compelling would be the case for the BOE to cut rates this year. Javid was due to present Britain’s budget in March. As CNBC reports, “media reports suggest that Javid was offered the chance to remain finance minister on the condition that he fires all of his advisors. He reportedly said no and opted to resign himself.”
China’s output levels far from normal: After the Chinese government encouraged businesses to re-open for a gradual pick up in economic activity following the 3-week long hiatus due to the Coronavirus, Morgan Stanley published real time measurements of Chinese pollution levels to reveal the true extent of the return to ‘business as usual’. As Zero Hedge notes, “what it found was that among some of the top Chinese cities including Guangzhou, Shanghai and Chengdu, a clear pattern was evident – air pollution was only 20-50% of the historical average.” Morgan Stanley concludes that “this could imply that human activities such as traffic and industrial production within/close to those cities are running 50-80% below their potential capacity."
US January CPI came a tad firmer: The US CPI came at +2.5% vs +2.4% y/y expected, while the reading when excluding food and energy was +2.3% vs +2.5% expected. The print is not going to shift the rhetoric away from a neutral Fed as inflation remains anchored at the low end. It’s also important to note that the drop in energy prices alongside the effects of a Chinese slow will most likely drag this print down in coming months. Nothing to see, move on.
The weakness in the Euro won’t abate: EUR/USD trades at the lowest level since May 2017 as it approaches 1.08. As reiterated yesterday, there has been no ‘new news’ acting as a catalyst to attribute for the steady selling. The overarching narrative for this one-way traffic seen seems to be the speculation that a dovish shift in rhetoric at the March ECB meeting could be in store. A piece by MNI, quoting an unnamed official, said “a few weeks ago, before the virus outbreak, I would have said that the policy outlook remained unchanged….but now the picture has changed. We just need to properly weigh up to what degree”.
ECB’s Lane considers low rates as temporary phase: ECB's chief economist Lane, in an interview with Reuters, said that the Euro area low interest rate phase is temporary, adding that the Euro area fiscal policymakers can do more. Lane went on to say that monetary stimulus is still effective and that the current Brexit uncertainty is holding back European economy despite recognizing that the UK is not big enough to be the driving force holding back the euro zone future in economic growth.
Mexican Central Bank lowers rates: Mexico cut rates by 0.25% to 7.0%, in a move that was widely expected. As the Research Team at NAB notes, “it is the 4h Emerging Market country to either cut rates or otherwise ease monetary policy (Singapore) since the COVID-19 outbreak.”
RBA Governor Lowe sounds more upbeat: Speaking on a panel, Lowe said that the outlook for the Australian economy is improving, noting that the coronavirus is having an uncertain impact, but absent the virus Oz outlook improving. The areas most affected by the virus scare, the RBA boss noted, included education and tourism. Lowe said that the Chinese policy stimulus will be a positive for Australia and that low interest rates are working but will take time.
Recent Economic Indicators & Events Ahead
(Click on image to enlarge)

(Click on image to enlarge)

Source: Forexfactory
Insights Into FX Index Charts
The EUR index is en-route to target its next 100% measured movement as the sell off phase continues unperturbed with no signs of the momentum abating. With the exception of one doji candle last week, the Euro has seen 8 straight day of losses, and what should still be very concerning for the brave bulls out there, the last 4 closes by NY ended near the day lows. This translates in a market with no overall appetite to build EUR long inventory just yet. The validation of a new bearish cycle by finding acceptance below the previous low was an inflection point as it cements the grip by sellers, likely to re-engage on retracements at regular intervals.
(Click on image to enlarge)

The GBP index has finally broken away from its consolidation, with those buyers engaging at the key level of support outlined in previous reports seeing the fruits of their bets. From a momentum standpoint, the Pound looks like it wants to target the previous swing high, currently with the backing of the smart money tracker and a break of structure. The close near the high of the day by the close of business in NY also tells me this market has further upside to go.
(Click on image to enlarge)
The USD index remains a solid bet to buy on dips, with the aggregated flows in the last 24h net positive, even if only marginally. The market structure and smart money tracker are still guiding us higher in this market. Remember, the USD has proven rather immune to the risk profile at play, which is a huge declaration of intention to support the currency until technicals deny the case, which we are far from it. I made the point yesterday that while the valuation in the USD is high, the current pullback seen is the most pronounced seen in 2020, hence if one is counting for further USD weakness, you are essentially betting on this pattern to be broken.
(Click on image to enlarge)

The CAD index made an attempt to break into bullish territory by breaching the previous swing high but it failed to sustain the momentum. Only when I see that the aggregated flows are able to piece through the previous swing high I will turn overall bullish this market. I must say the smart money tracker is already pointing bullish, but without the backing of the daily structure, we are missing one important piece of the puzzle to cement the bullish case. As I wrote yesterday, it’s not all done yet as the index has stalled at the resistance level one would have anticipated, with the tick volume suggesting little commitment by buyers so far.
(Click on image to enlarge)

The JPY index keeps finding buy-side pressure every time the level of horizontal support is tested. The current profile that best defined this market for now is range-bound until there is a resolution below the equal low or above the previous swing high. Only then, the next declaration of intentions by either side will be made and a calibration of the bias will be possible. Until that’s the case, the technicals are not as clear cut as they were in previous weeks. This mixed picture is also reflected on the smart money tracker flattening out but still marginally bullish.
(Click on image to enlarge)

The AUD index keeps finding selling pressure off a resistance line. What has me worried so far is that based on the aggregated tick volume, the second retest into this resistance was far from compelling as the buy-side volume activity was reducing. The price structure of lower lows and lower highs continues to be in place, so even if the slope of the smart money tracker has turned bullish, it does not yet vindicate the bullish bias until there is acceptance above the previous swing high. Longs the AUD remain a risky bet for now as technicals stand.
(Click on image to enlarge)

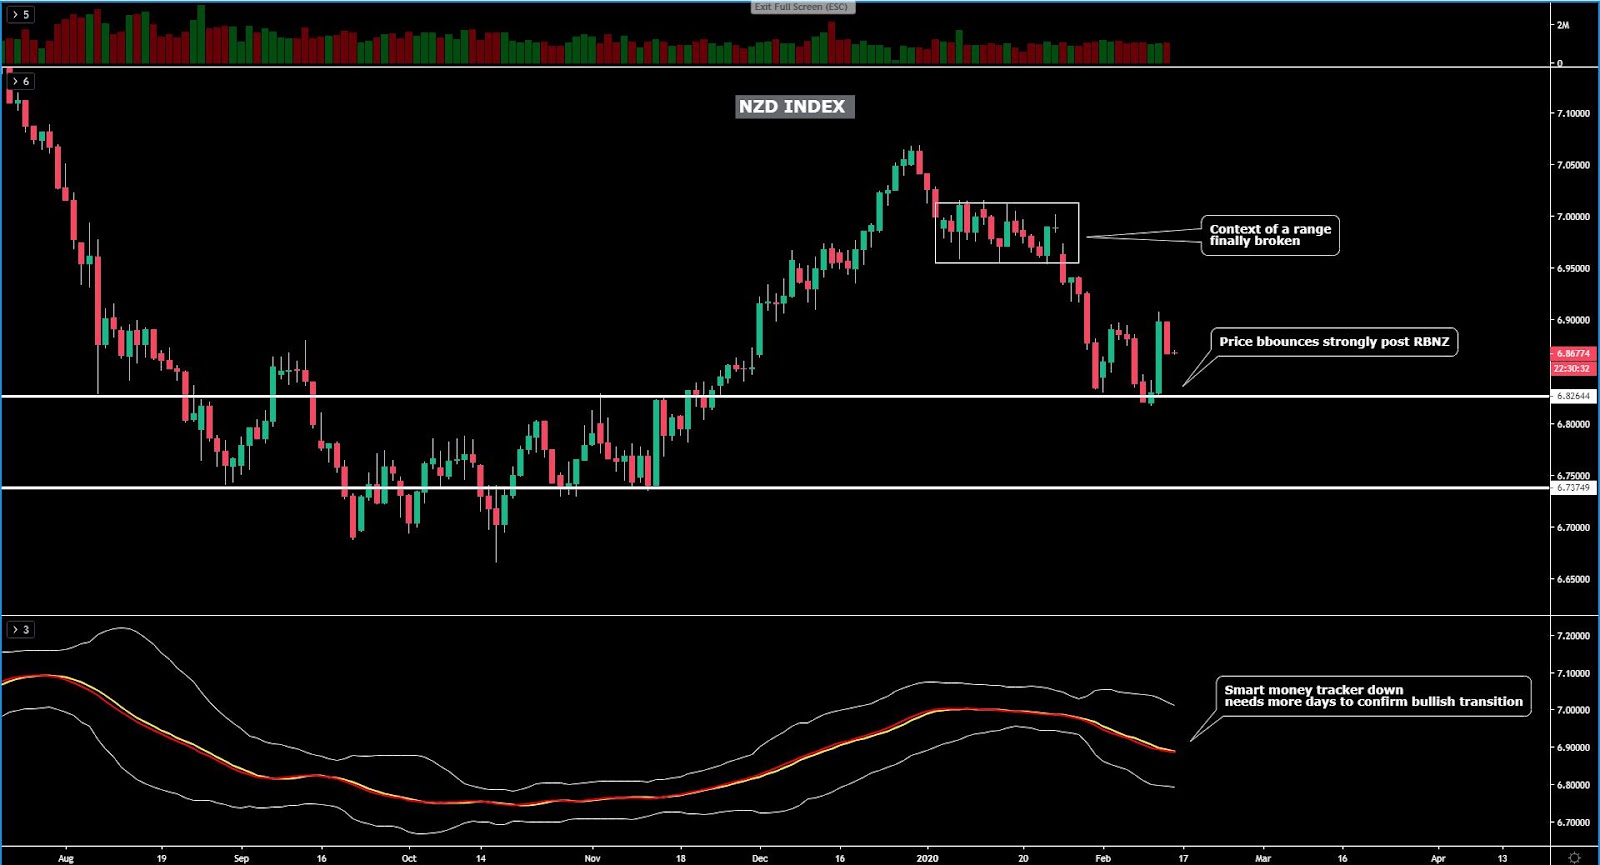
The NZD index saw a major spike on the back of the RBNZ hawkish surprise, and as one would be expecting, it has retraced from overbought conditions ever since. This markup still carries the momentum behind to see further gains short-term as it was stimulated by a Central Bank decision that is looking to steer its policy away from an easing bias. If we continue to see the gradual fading of the coronavirus concerns, coupled with the new neutral stance by the RBNZ, this could be the onset of a prolonged trend in the Kiwi. We shall let technicals determine that.
(Click on image to enlarge)
The CHF index has finally seen a watershed moment, technically speaking, as it’s the first time that the price structure and the smart money tracker align to the downside. However, with the index yet to clear an important area of unfilled orders as per the origin of the Jan 30 demand, one must definitely account for this potential stumbling block for sellers. Only when we see the price clearing this demand and a breakout of the prior line of support the bearish case can really gain more credence. Until then, we could really go either way.
(Click on image to enlarge)

Important Footnotes
Market structure: Markets evolve in cycles followed by a period of distribution and/or accumulation. To understand the principles applied in the assessment of cycles, refer to the tutorial How To Read Market Structures In Forex
Horizontal Support/Resistance: Unlike levels of dynamic support or resistance or more subjective measurements such as fibonacci retracements, pivot points, trendlines, or other forms of reactive areas, the horizontal lines of support and resistance are universal concepts used by the majority of market participants. It, therefore, makes the areas the most widely followed and relevant to monitor. The Ultimate Guide To Identify Areas Of High Interest In Any Market
Fundamentals: It’s important to highlight that the daily market outlook provided in this report is subject to the impact of the fundamental news. Any unexpected news may cause the price to behave erratically in the short term.
Projection Targets: The usefulness of the 100% projection resides in the symmetry and harmonic relationships of market cycles. By drawing a 100% projection, you can anticipate the area in the chart where some type of pause and potential reversals in price is likely to occur, due to 1. The side in control of the cycle takes profits 2. Counter-trend positions are added by contrarian players 3. These are price points where limit orders are set by market-makers. You can find out more by reading the tutorial on The Magical 100% Fibonacci Projection
The Daily Edge is authored by Ivan Delgado, Head of Market Research at Global Prime. The purpose of this content is to provide an assessment of the market conditions. The report takes an in-depth ...
more

