The Long Expansion Continues
The Bureau of Economic Analysis announced yesterday that U.S. real GDP grew at a 2.6% annual rate in the fourth quarter of 2018. That’s below the 3.1% average for the U.S. economy over the last 70 years, but better than the 2.2% average rate since the recovery from the Great Recession began in 2009:Q3.
(Click on image to enlarge)

Real GDP growth at an annual rate, 1947:Q2-2018:Q4, with the 1947-2018 historical average (3.1%) in blue and post-Great-Recession average (2.2%) in red.
One can also look at the year-over-year growth rate, which smoothes out some of the measurement error in the quarterly growth numbers. This climbed throughout 2018, and we ended the year with the highest year-over-year growth rate since 2015:Q2.
(Click on image to enlarge)
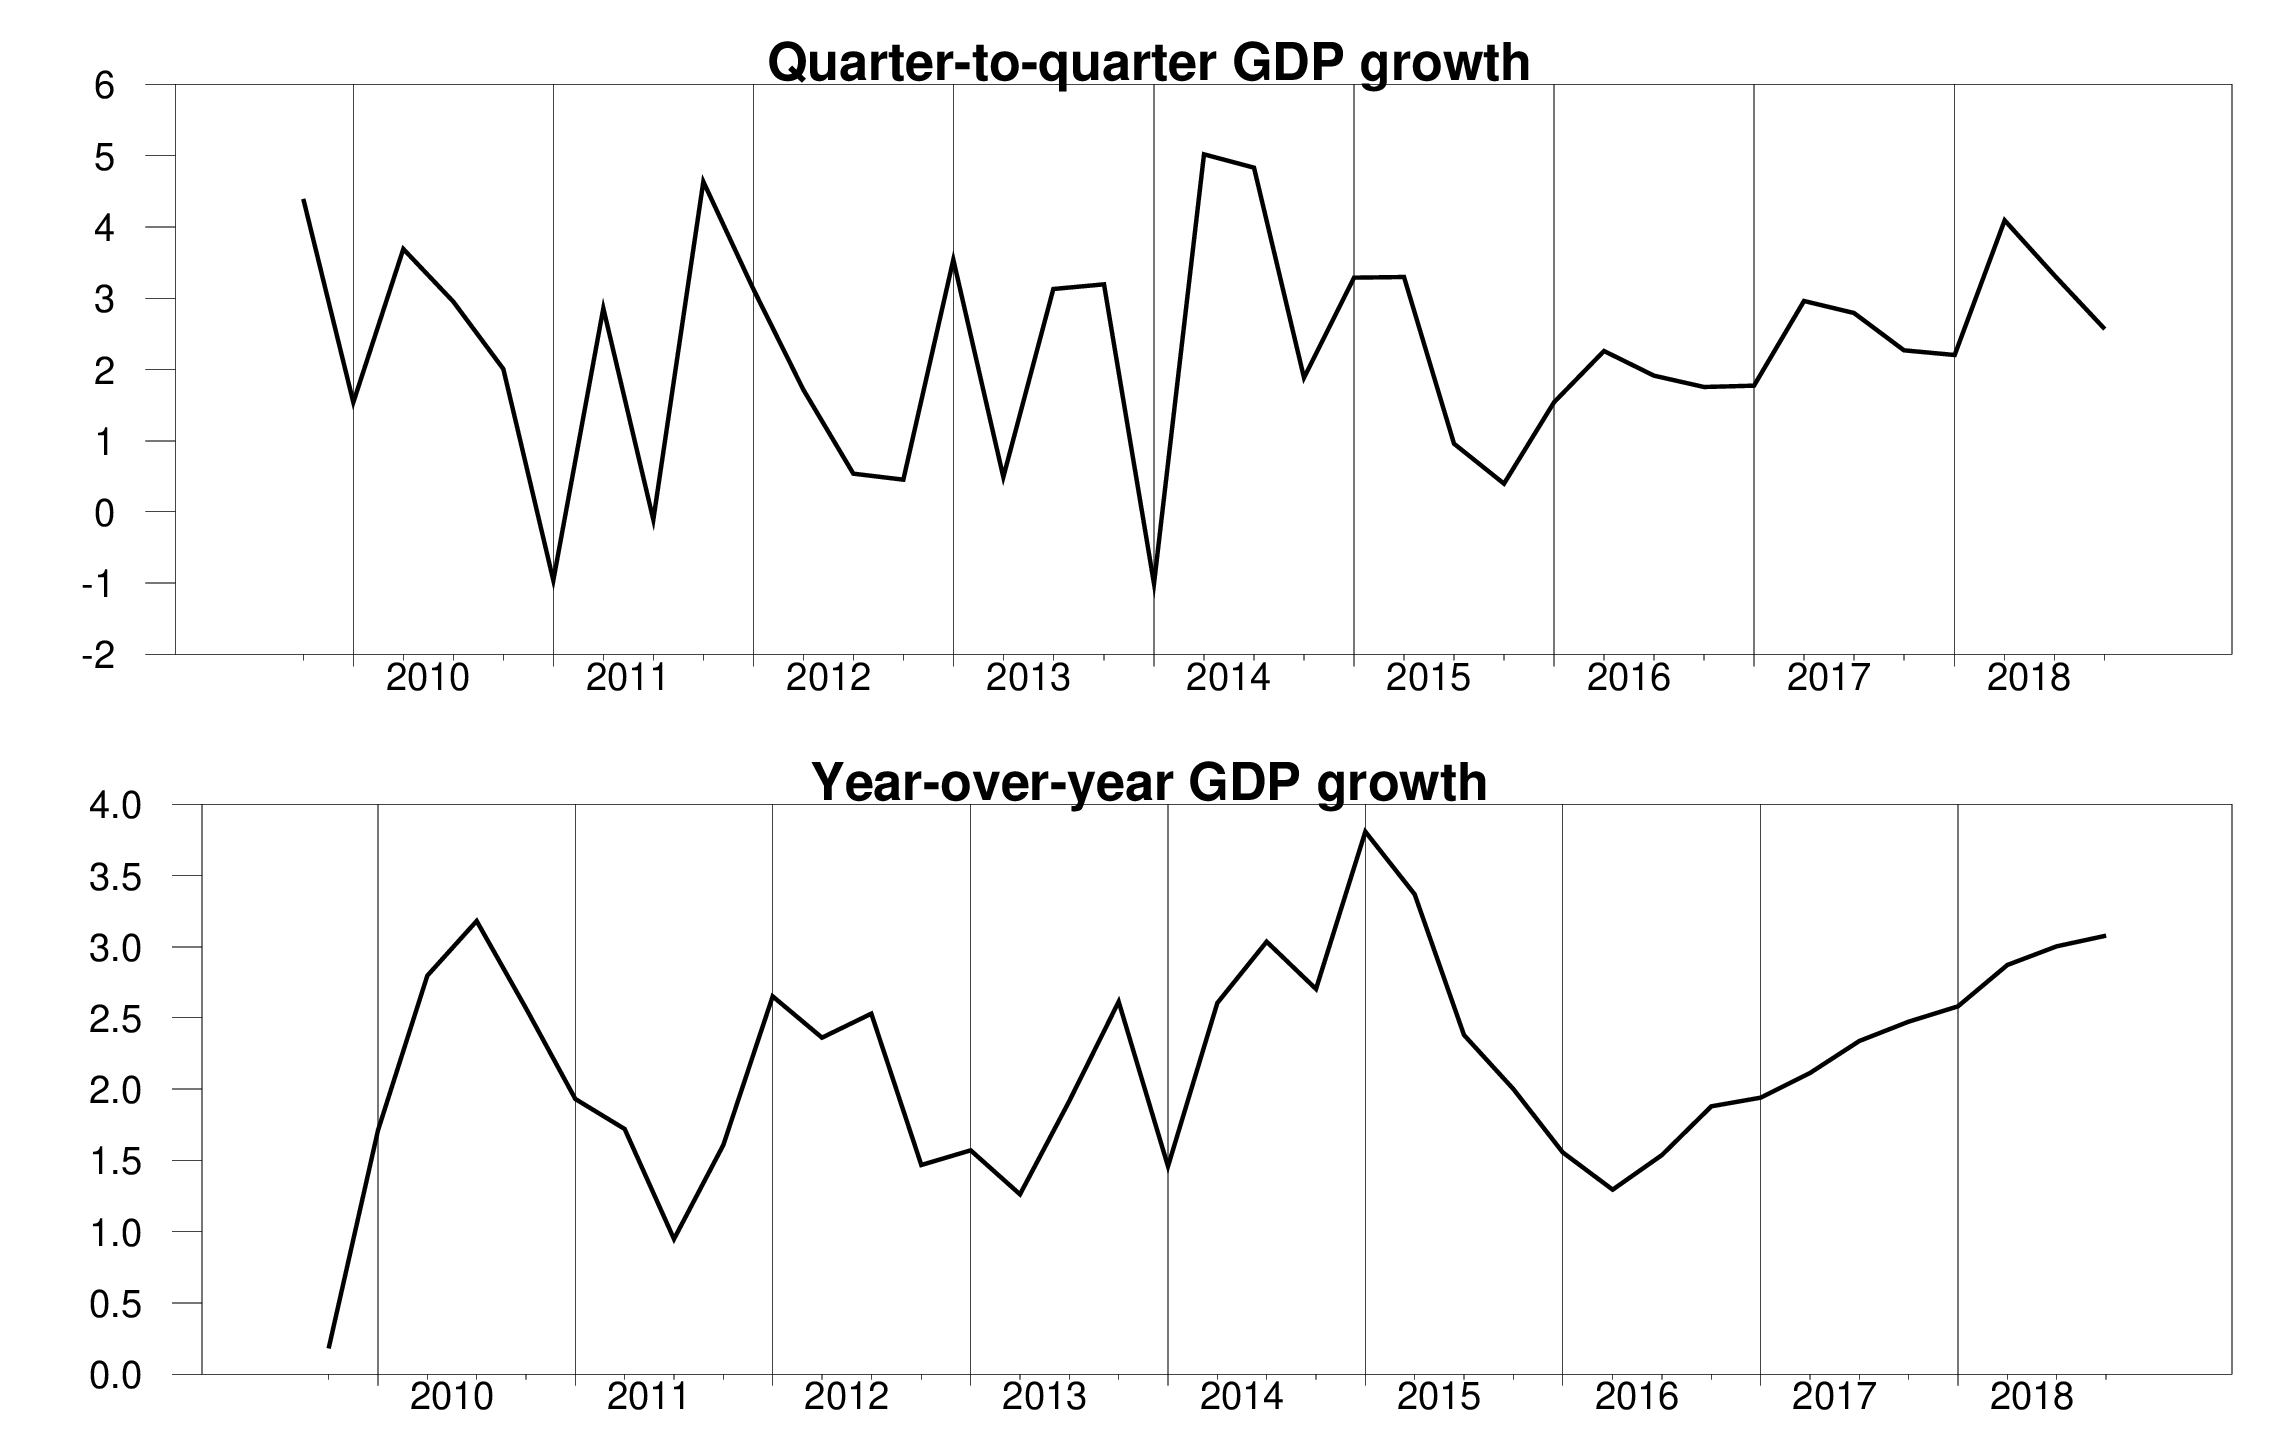
Top panel: quarter-to-quarter real GDP growth, quoted at an annual rate, 2009:Q4 to 2018:Q4. Bottom panel: year-over-year real GDP growth. Vertical lines denote first-quarter observations.
The solid growth numbers kept the Econbrowser Recession Indicator Index at 1.5%, among the lowest levels we ever see. That means the U.S. economic expansion has now been underway for 9-1/2 years, 2 quarters shy of the longest expansion on record (1991:Q2-2001:Q1).
(Click on image to enlarge)
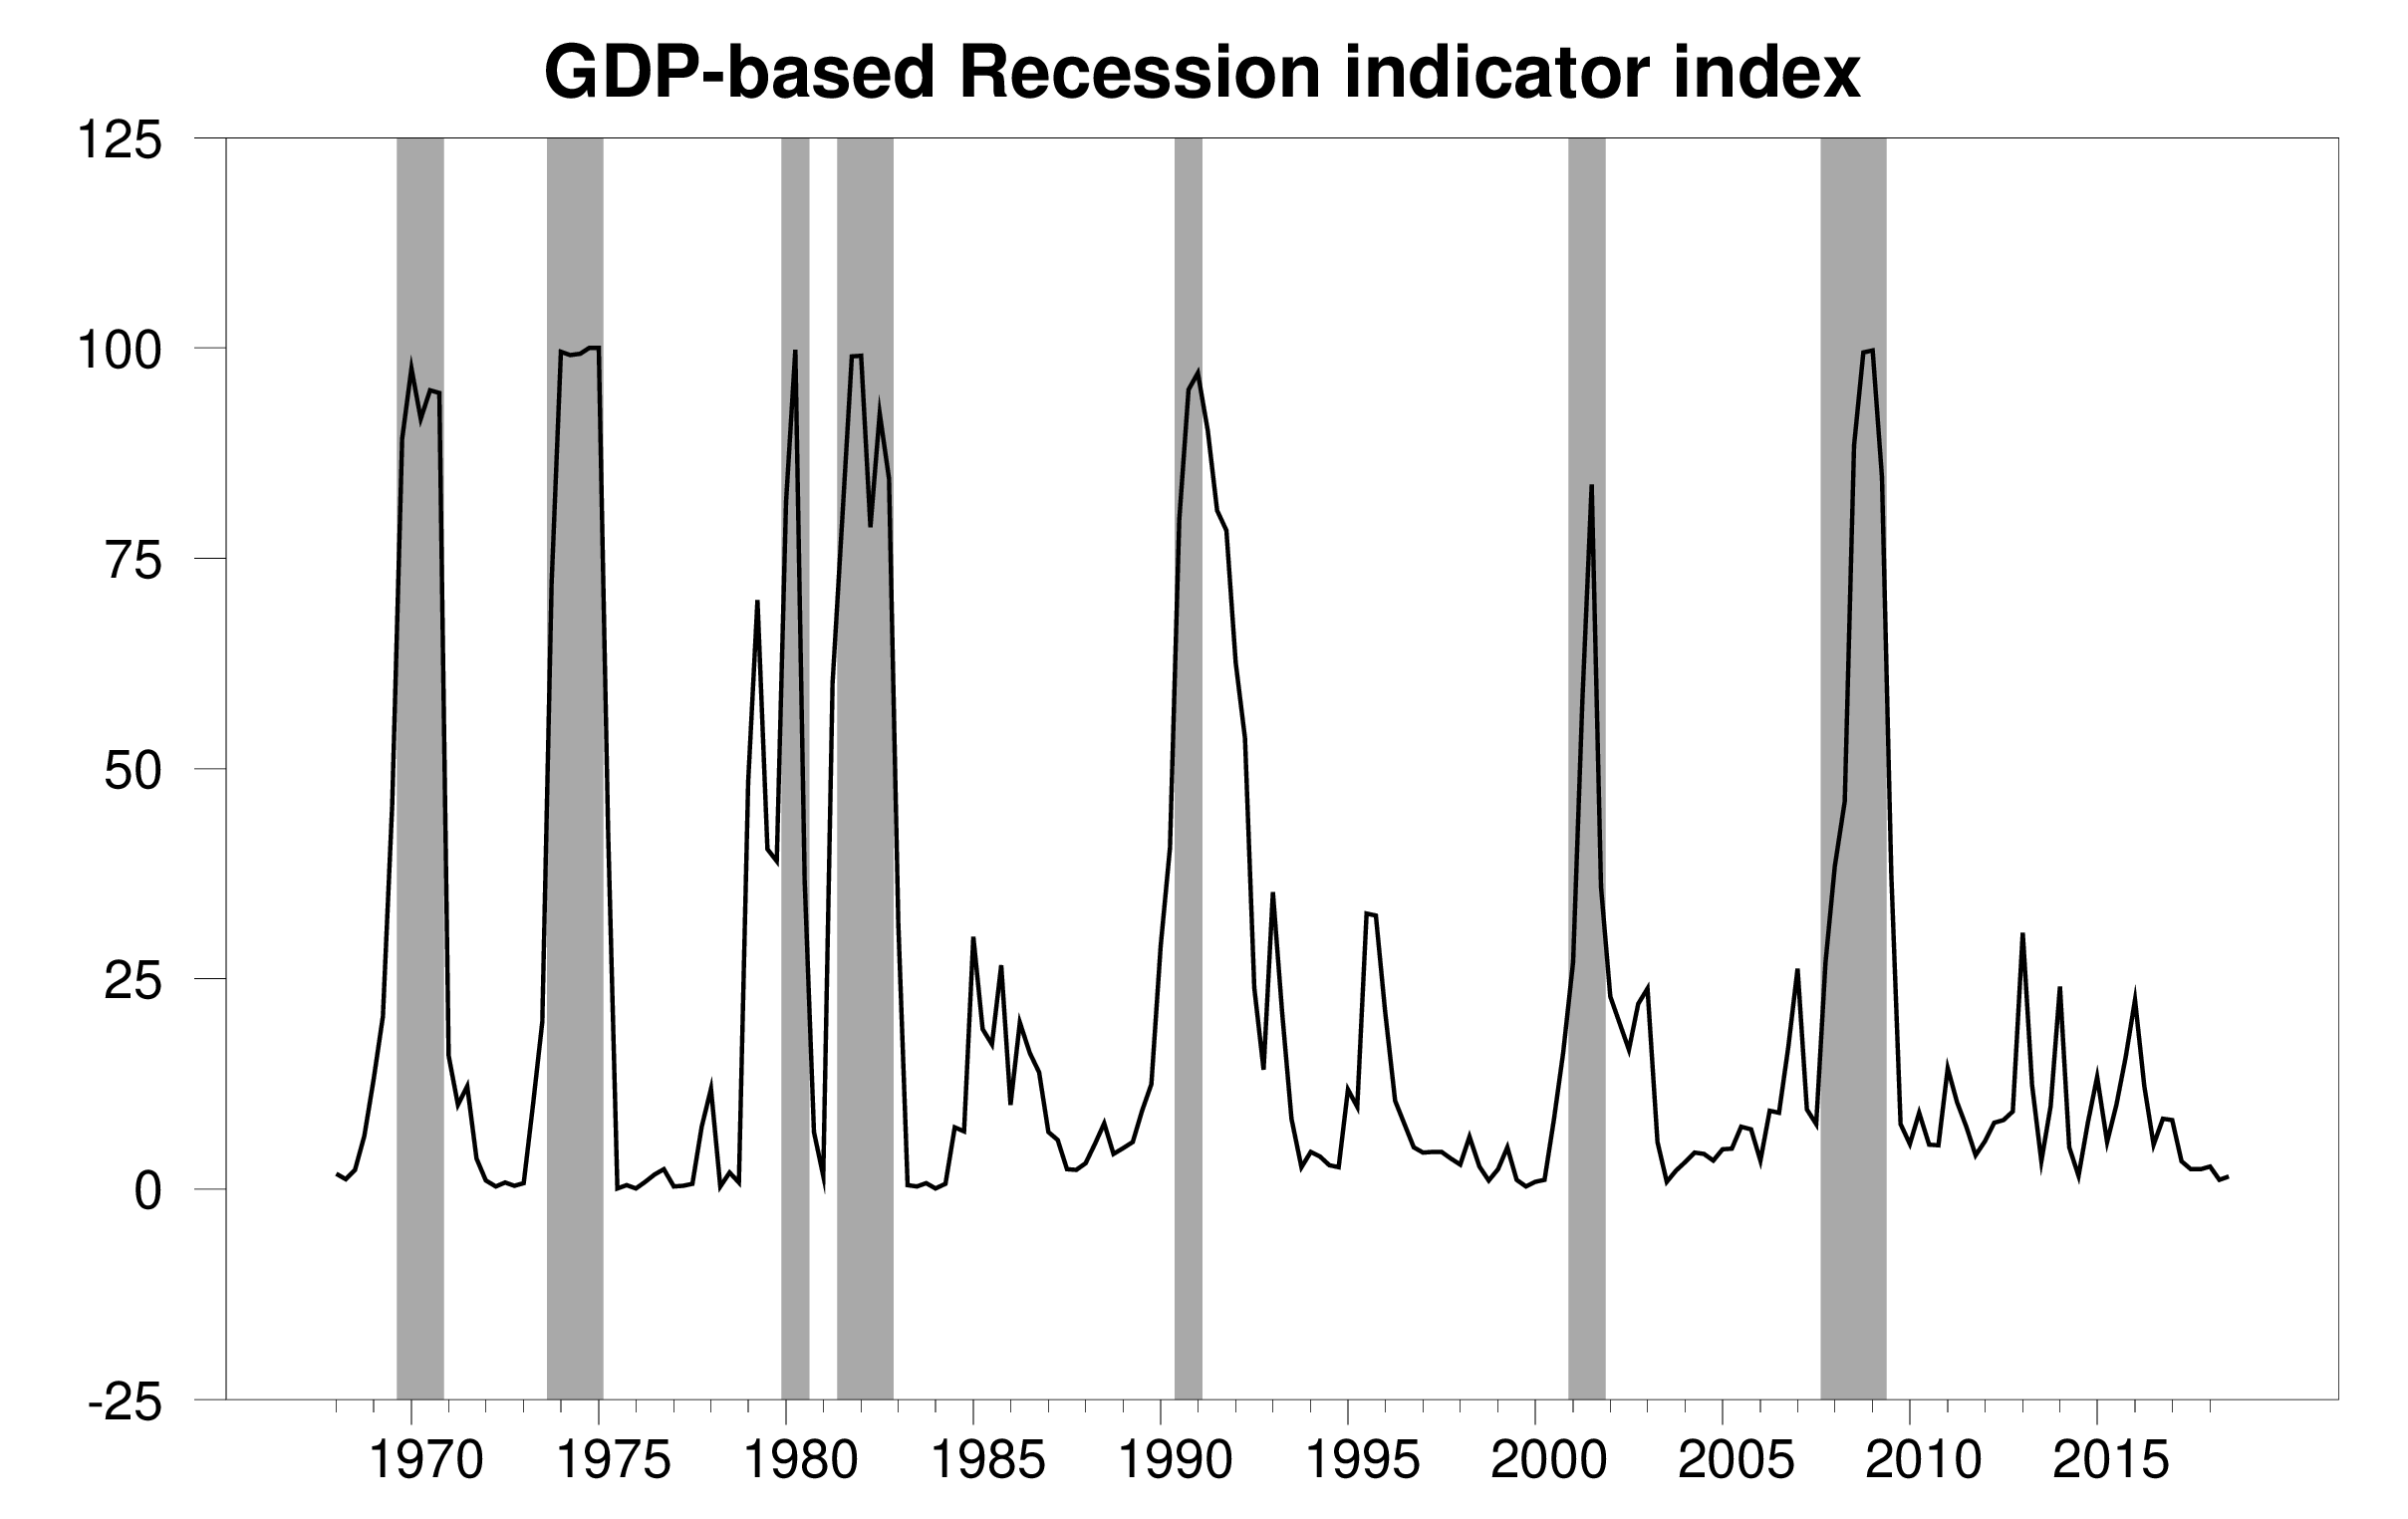
GDP-based recession indicator index. The plotted value for each date is based solely on information as it would have been publicly available and reported as of one quarter after the indicated date, with 2018:Q3 the last date shown on the graph. Shaded regions represent the NBER’s dates for recessions, which dates were not used in any way in constructing the index, and which were sometimes not reported until two years after the date.
It was encouraging to see nonresidential fixed investment make a positive contribution to both Q4 and year-over-year growth. That’s a key cyclical contributor in a typical expansion and also provides the basis for future productivity growth.
(Click on image to enlarge)
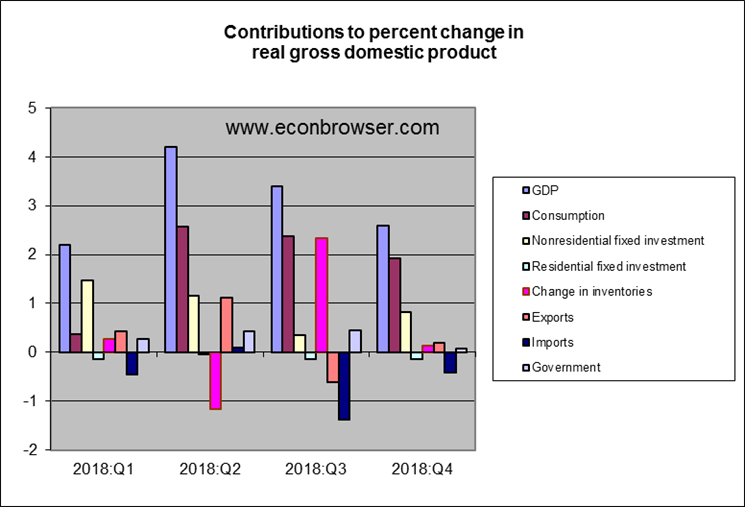
On the other hand, residential fixed investment is another variable that usually helps power a cyclical expansion. But housing was a slight drag on GDP throughout 2018.
(Click on image to enlarge)
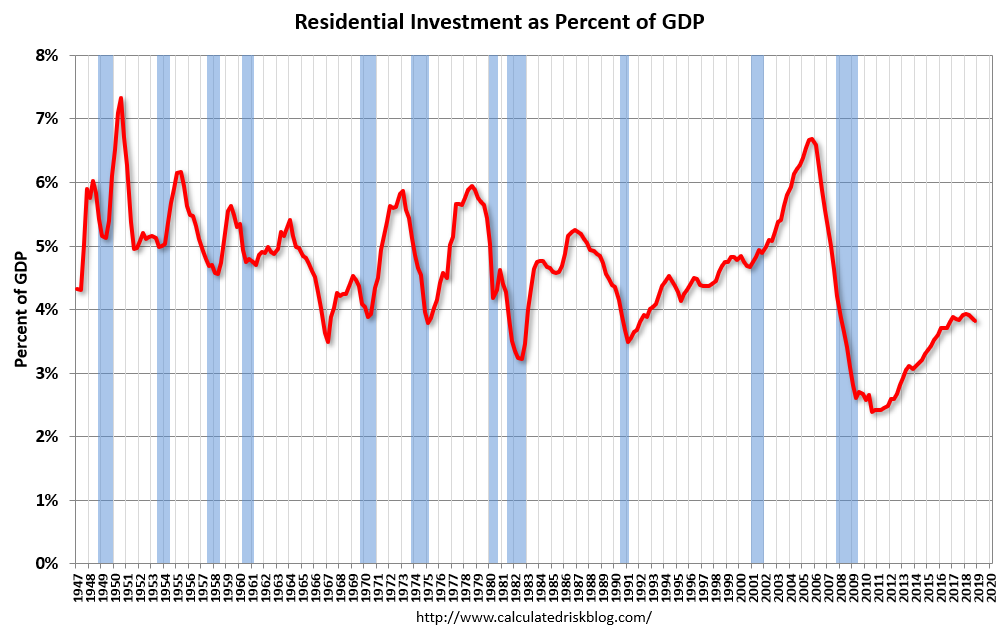
Residential fixed investment as a percent of GDP. Source: Calculated Risk.
Interest rates may have been one factor holding back housing. The 30-year mortgage rate rose from 3.5% in the fall of 2016 to close to 5% last November. The rate has come back down significantly since then, though historically new home sales take several months to respond to changes in interest rates. Perhaps limits on tax-deductibility of mortgage payments implemented in 2018 were another factor.
(Click on image to enlarge)
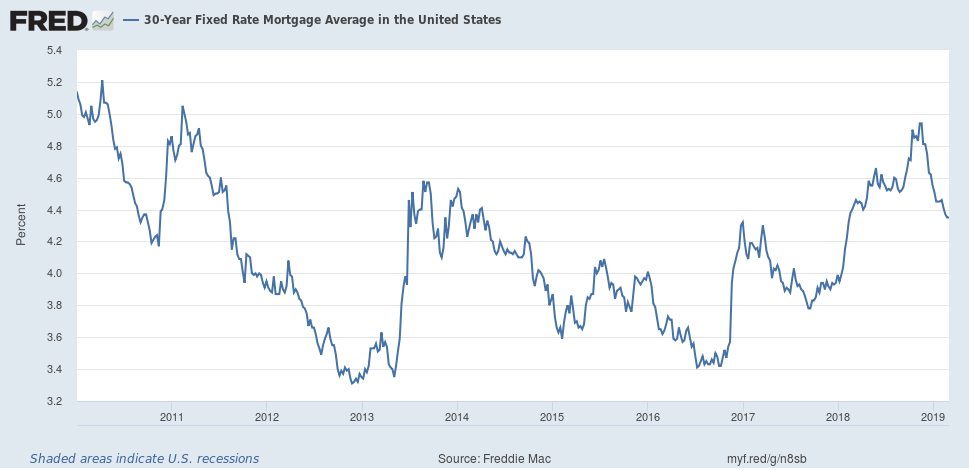
Thirty-year fixed mortgage rate, Jan 1, 2010, to Feb 28, 2019, from FRED.
The GDP data were a month late being released due to the government shutdown. That event may also show up in the level of GDP when we see the numbers for 2019:Q1.
Disclosure: None.


