
The Hidden Cost Of Renewables
Renewables receive a disproportionate share of media coverage given their still small size. In 2019, less than 9% of America’s power came from solar and wind. Fossil fuels (mainly coal and natural gas) are over 62%. Moreover, electric power is only 37% of our total energy use. Renewables receive outsized attention because of the hope they will lead to lower emissions. A look at recent daily data on U.S. power generation illustrates the challenges we’ll face in relying on intermittent, low-density sources of energy.
California is a leader in moving away from fossil fuels. We should hope the rest of America doesn’t seek to emulate them, because Californians pay the most for the least (see California Dreamin’ of Reliable Power).
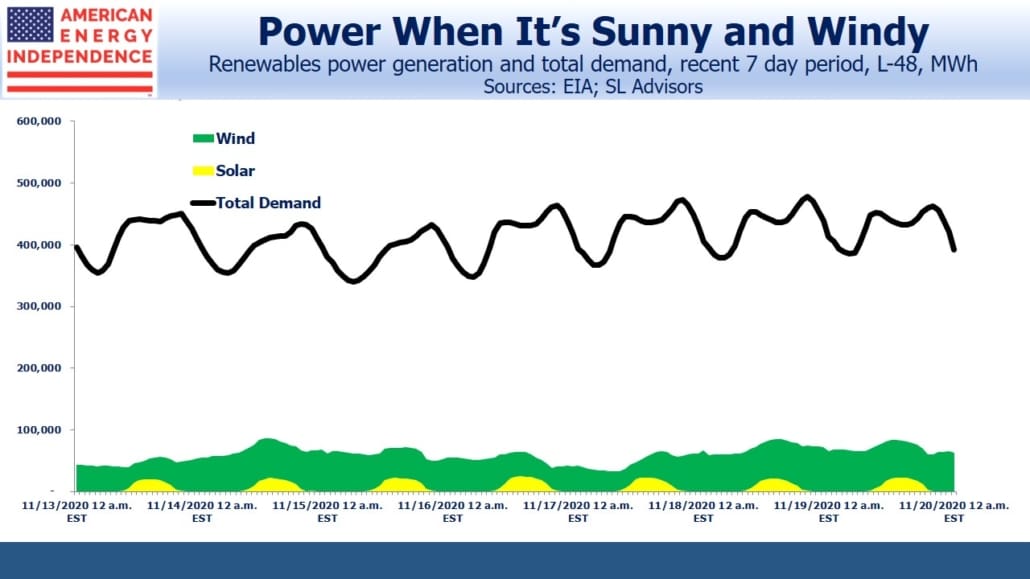
The first four charts draw on hourly electricity generation across the lower-48. Solar and wind are both intermittent – solar is fairly predictable, and wind less so. The challenge for grid operators is matching demand with supply.
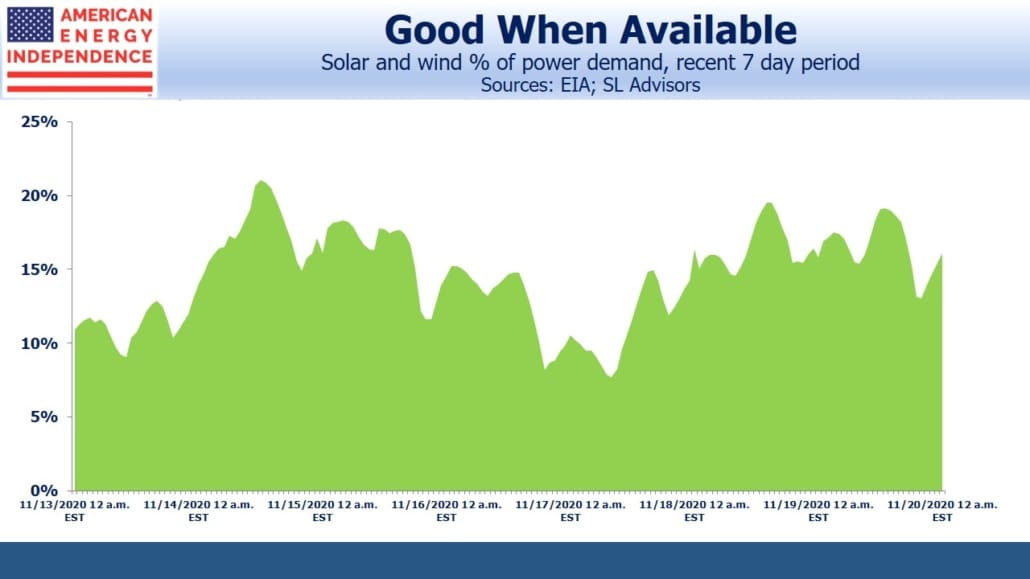
Over a recent seven day period, solar and wind provided 15% of our electricity, but the range was between 8% and 21%. Because their share is still small, this variability is easily managed by dialing other power sources up or down as needed. Natural gas combined cycle (NGCC) plants have the advantage of being easily recalibrated to accommodate fluctuations in nature’s power output. Their flexibility enables increased use of renewables – a benefit Californians are denied because of a purist dogma that has seen them phase out even natural gas power plants.
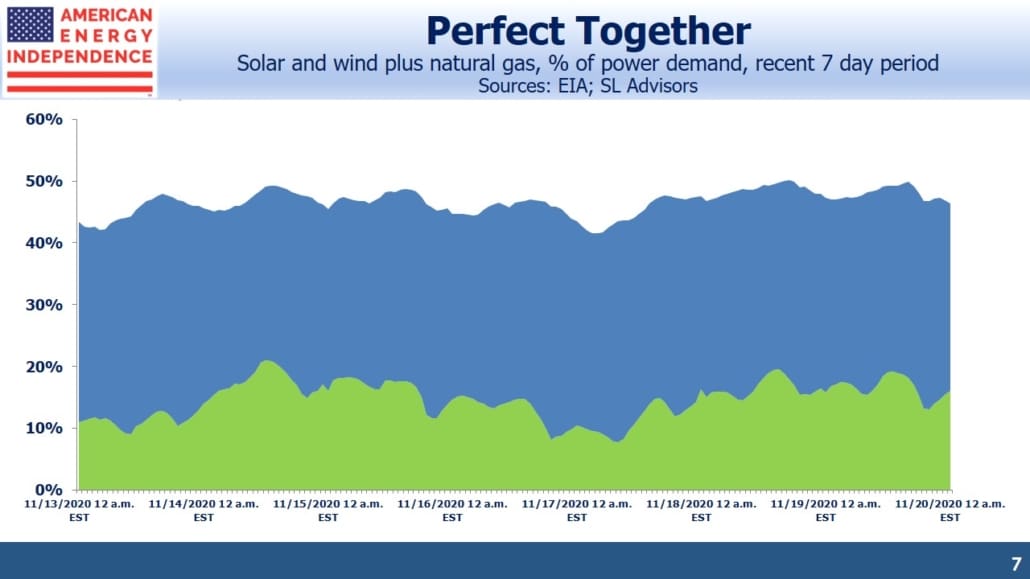
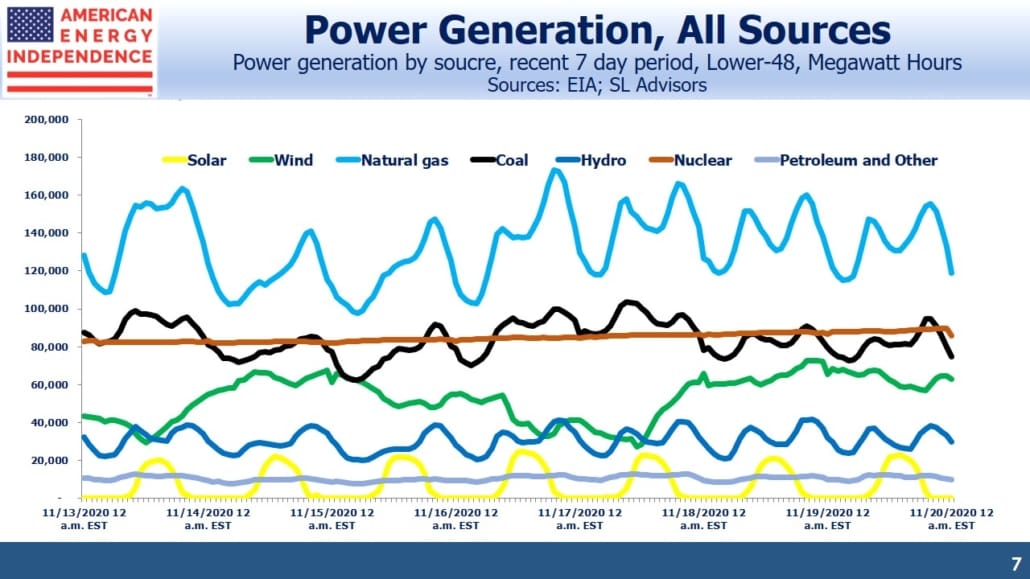
In combination, solar, wind and natural gas provided almost half our electricity over a recent seven-day period. What’s especially interesting is that natural gas output is strongly negatively correlated with the intermittent sources. This highlights the symbiotic relationship between the two.
Power demand isn’t constant – it’s higher during the day and peaks around dinner time. So we need variable sources of power. For example, if we used nuclear power exclusively, its constant output would require either storage or supplementary power to match demand.
Cost estimates of intermittent power sources need to include either complimentary natural gas power or battery back-up. Breathless media coverage of the topic rarely considers the fully-loaded costs.
The chart below is from a paper published by the University of North Carolina which compared the cost of electricity from an NGCC with different combinations of renewables and back-up to achieve the same output for the 85% of the time such plants typically run. Solar and wind generally product at about 25% of capacity.
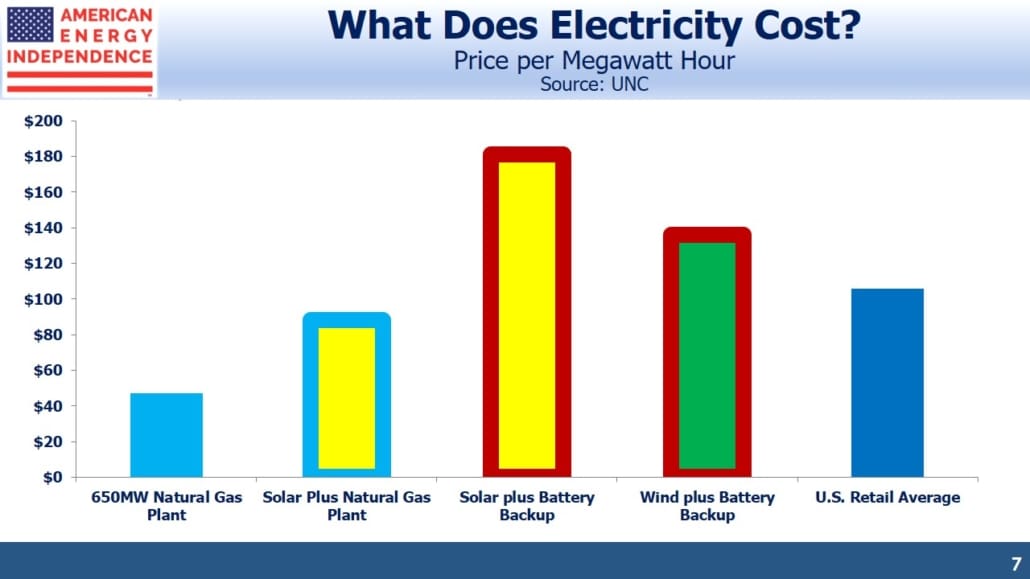
None of the alternatives are cheaper than an NGCC, although solar with NGCC back-up is the cheapest of the three alternatives considered.
In recent years natural gas (UNG) has been the biggest contributor to falling U.S. emissions, and is enabling increased use of renewables. Continuing this success is our best path to combating climate change.
We are invested in all the components of the American Energy Independence Index via the ETF that seeks to track its performance.
The information provided is for informational purposes only and investors should determine for themselves whether a particular service or product is suitable for their investment needs. Graphs and ...
more

