
The Gold Manipulation Silliness Continues
Not surprisingly, one of the silliest explanations for last week’s sharp decline in the gold price appeared in an article posted at the Zero Hedge website. According to this article, the only plausible explanation for the decline is rampant manipulation while China’s markets were closed for the “Golden Week” public holidays*.
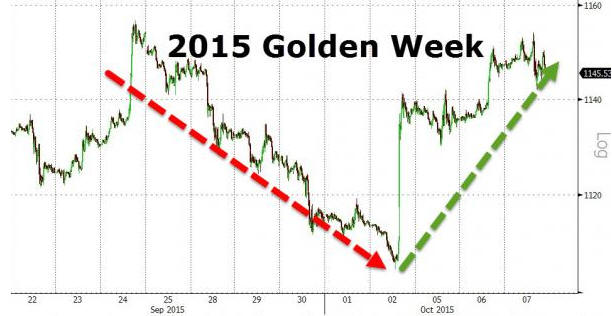
In an effort to prove that manipulators in the West routinely take advantage of China’s markets being closed to suppress the gold price, the article includes charts covering the 2015 and 2014 “Golden Week” holiday periods. These charts suggest that, as was the case this year, the gold price tanked during each of the preceding two years when China was closed for business. However, the charts are very misleading. Deliberately so, in my opinion.
For example, the following chart from the article suggests that the gold price plunged from the $1140s to around $1105 during the 2015 “Golden Week” holidays and then quickly recouped its losses after China’s markets re-opened, but that’s not the case. The “Golden Week” is from 1st to 7th October every year, so what actually happened was that the gold price fell from the $1140′s down to around $1115 during the days leading up to the 2015 “Golden Week” (while China was open for business) and then rebounded to the $1140s while China was on holiday.

During the 2014 “Golden Week” holiday period there was no net change in the gold price.
The belief that manipulation is the be-all-and-end-all of the gold market is based on two false premises. The first is that the fundamentals are always gold-bullish. The second is that when financial markets are free from manipulation they always move in concert with the fundamentals. If you hold these two totally wrong beliefs then every time there is a significant decline in the gold price you will naturally conclude that manipulation was the cause.
The reality is that gold’s true fundamentals have been deteriorating since July and that the pace of deterioration picked up over the past three weeks. At the same time, speculators in gold futures were adding to the risk of a steep downward price adjustment by stubbornly maintaining an extremely high net-long position.
The following chart compares the gold price with the bond/dollar ratio. The fundamental deterioration and the delayed response of the gold market can clearly be seen on this chart.
Gold market participants and observers who were looking at the right indicators will not have been surprised by last week’s price decline.
*China is apparently the bastion of honest price discovery in the gold market and corrupt Western bankers apparently wait for the Chinese to go on vacation before launching their bear raids.
Disclosure: None.


thank for sharing
Silliness? Watching gold go from 995 GBP to 1070 and back again in a matter of seconds and being blamed on someone with a fat finger? Its was much more spectacular on a five second chart. The market is constantly manipulated which is why there is now a lawsuit against the banks involved for manipulation. Silliness is accepting someone elses reasoning above your own.
thanks for sharing
thanks for sharing