
The Gold & Silver Corrective Rally Is Almost Over
Strong words, aren’t they? And yet, we are not afraid to put them right in the title. The number of factors (and their importance) that point to a nearby reversal and continuation of the major decline is too significant to believe in the bullish case, even though gold, silver, and mining stocks moved higher in the last few days.
We emphasized it many times and we will continue to do so, as it’s very easy to forget about it when things get volatile on a day-to-day basis. The long-term signals are far more important than the short-term ones. In a fight, it’s not always the bigger guy (or gal) that has the advantage, but in certain circumstances it’s obvious that weight matters (please keep this picture in mind while reading about the possible counter-trend upswing in the short run – that’s the little guy while the big guy are the powerful long-term factors). That’s exactly the case with the weight and importance of long-term signals when comparing them to the short-term ones. Surely, we could get a 1-2% upswing, but so what, if a 15% decline is just around the corner? And in particular, if it could take place right away?
The most recent rally in gold and the rest of the PMs was most likely triggered by market’s (most likely incorrect, but understandable) reaction to the increased Brexit tensions. Quoting finance.yahoo.com:
BREXIT: On Thursday, discord over British Prime Minister Theresa May's plan for Britain's departure from the European Union next year shook major European stock indexes and the pound. She persuaded a majority in her Cabinet to back an agreement that would allow Britain to stay in a customs union while a trade treaty is negotiated, but the deal faces an uncertain fate in Parliament and two of her Cabinet ministers, including the Brexit minister, resigned in protest.
Gold soared on the Brexit vote, and now when it’s becoming less certain that the Brexit would have a major impact on the UK and if it takes place at all… Gold and the rest of the PMs rallies again? Pointless, right? Indeed, but on a very short-term note, markets viewed this as the increase in global uncertainty and the PMs reacted to it. It is not logical, but emotional and that’s exactly what one can expect from the market in the short run.
It’s important to keep in mind that geopolitical events tend to have only a temporary impact on the gold prices. This will most likely be the case also this time. Investors will realize that nothing really changed, and what changed was actually bearish for gold as the “status quo” option in which the UK stays in the EU became a bit more probable.
Having said that let’s take a look at the charts to check how much changed from the technical point of view.
The USD Index Changes
(Click on image to enlarge)
As far as the USD Index is concerned, nothing changed yesterday, and our previous comments remain up-to-date:
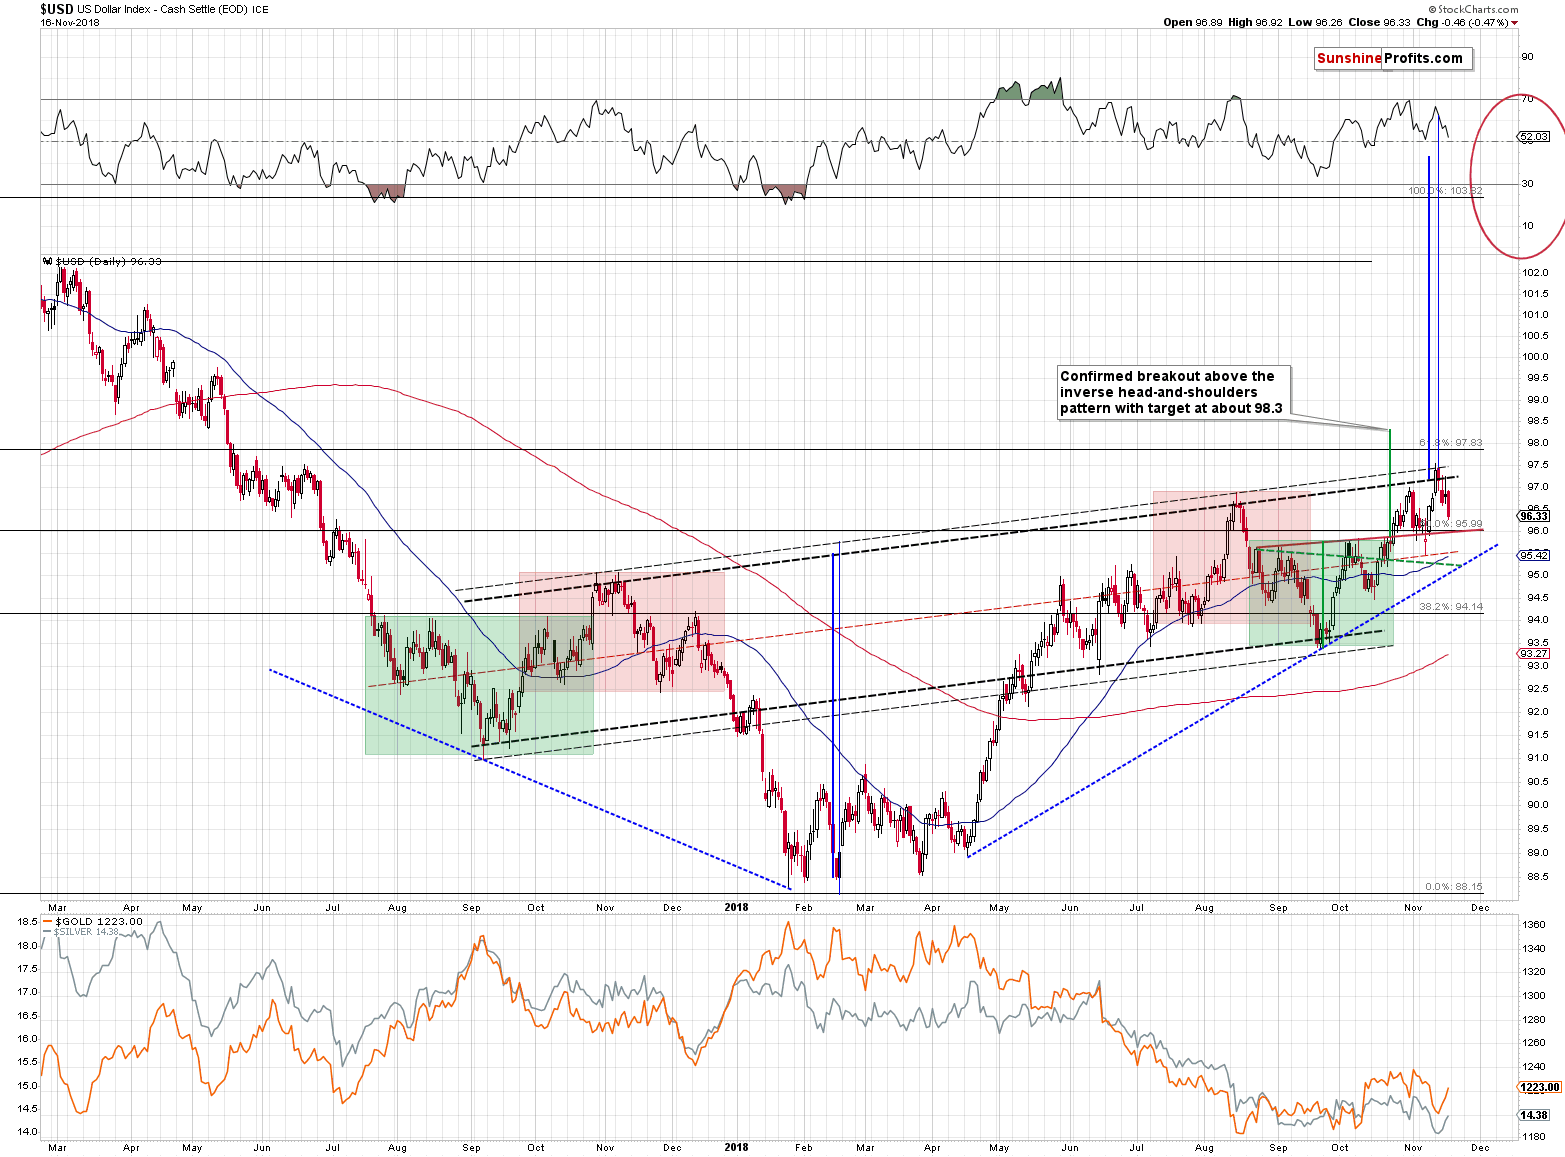
We recently saw an invalidation of the tiny breakout above the medium-term inverse head-and-shoulders pattern, which could trigger some short-term weakness. But, such weakness is not likely to be very significant.
The USD Index is following the reflective pattern, in which the 2018 rally is a reflection of the 2017-2018 decline. The current situation seems to be similar to what happened in early August 2017. Back then we saw a zigzag, so perhaps we’ll see some king of zigzag here as well. Back then the zigzag had higher highs and higher lows, which suggests that it now should have lower highs and lower lows. Then again, the symmetry is not direct as the medium-term highs are and lows are now higher (August 2018 high is higher than the November 2017 high), which could distort the direct zigzag analogy.
All in all, it seems that the USD Index could decline to the November low at most and quite likely not lower than to the 96 level. That’s where we have the neckline of the local inverse head-and-shoulders pattern and the 50% Fibonacci retracement level based on the previous medium-term decline. The downside seems quite limited. This means that the upside for the precious metals sector is likely limited as well.
Gold’s Important Signals
(Click on image to enlarge)
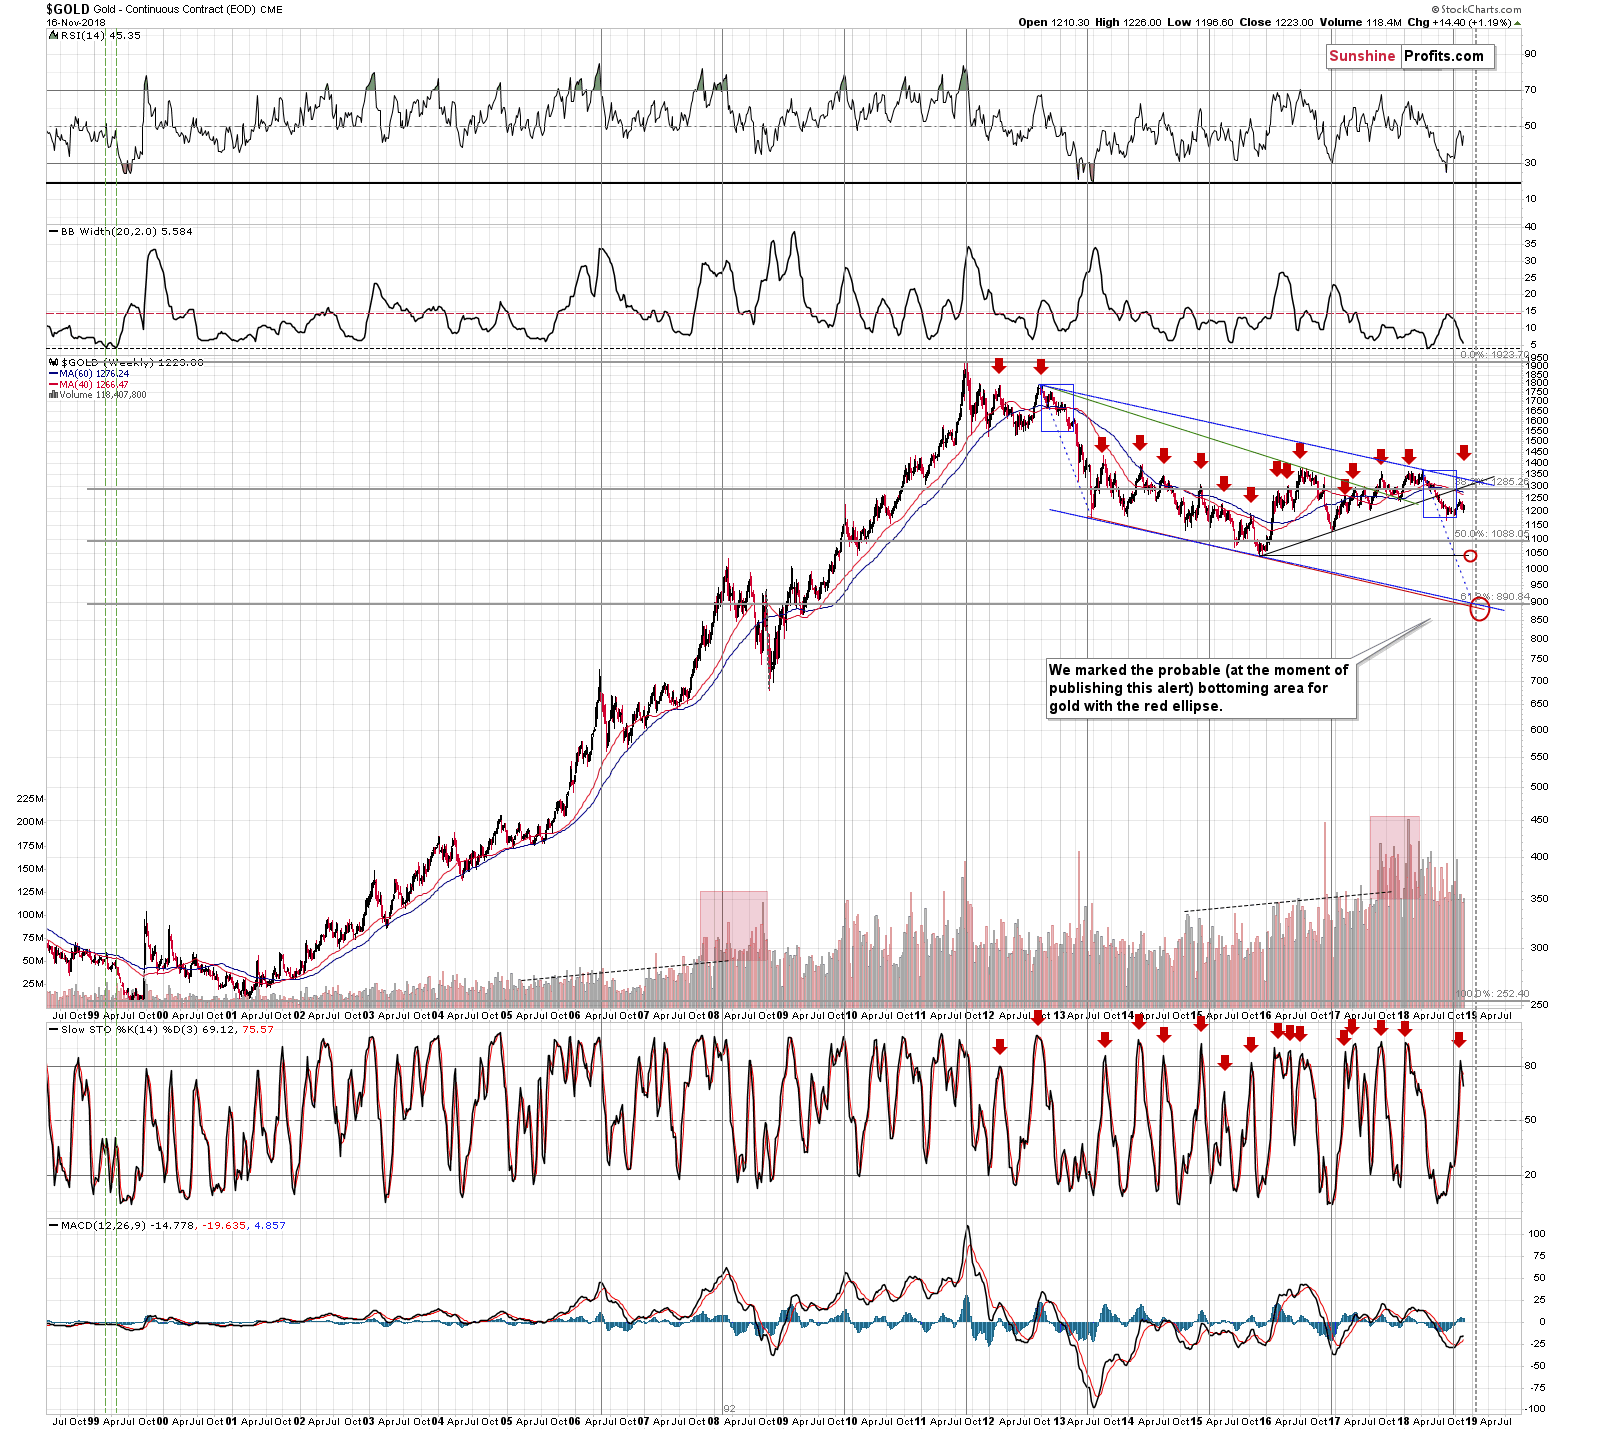
From the long-term point of, we see that the sell signal from the weekly Stochastic indicator remain in place even though gold moved almost $15 higher last week.
We also see that gold’s very long-term cyclical turning point (marked with vertical lines) worked once again as it triggered a short-term rally in the yellow metal. This rally may already be over as the recent move is similar in size to the follow-up of the turning point from the first half of 2015. There were also cases when gold moved much higher after the turning point, but the thing that we would like to emphasize is that a move higher doesn’t have to happen based on this factor. The recent upswing is already in tune with what we saw previously, so what was likely to happen based on this factor, seems to have already happened.
However, the key thing to keep in mind is gold’s similarity to what happened in 2013. If it’s not apparent at the first sight, please note the rectangle that covers the 2012 top and the 2013 decline. This rectangle was copied into the current situation (it’s exactly the same rectangle in terms of both: price and time). The size of the decline, it’s shape and time when the final corrective upswing took place are remarkably similar. The corrective upswing took gold higher by a similar amount (percentage-wise) and it seems that we are only days (not weeks) away from the start of the golden carnage.
(Click on image to enlarge)
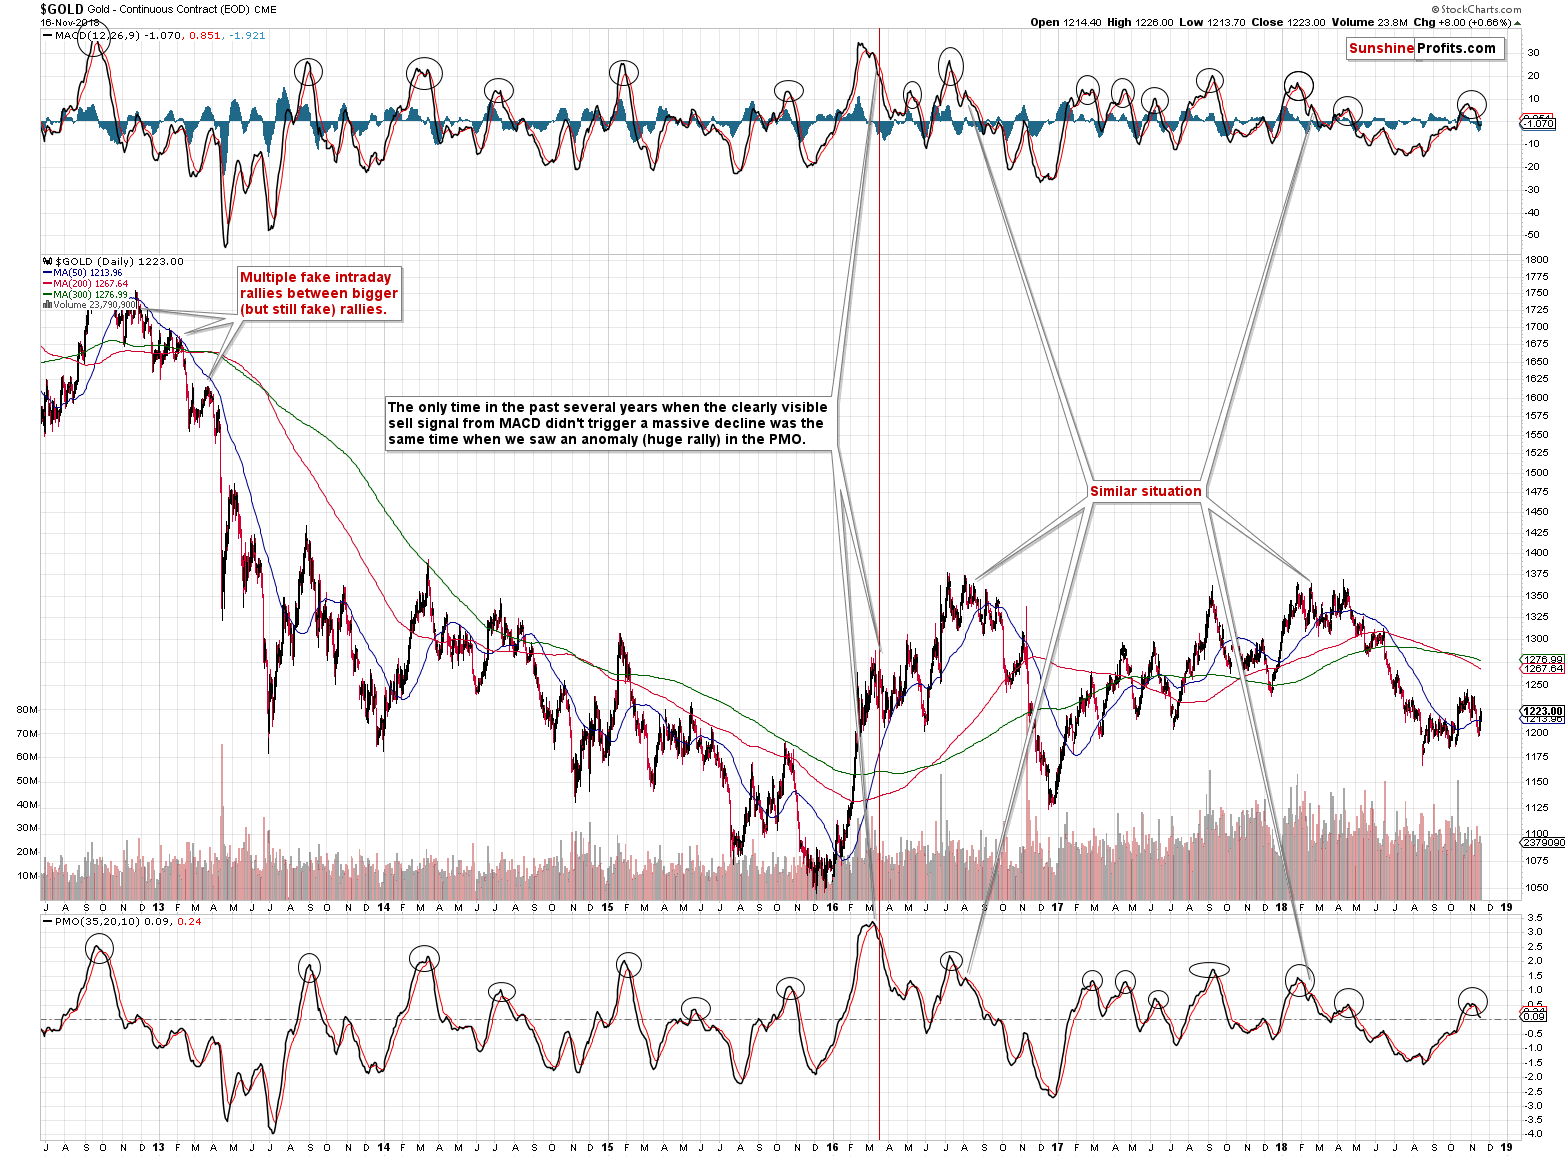
Both: MACD and PMO indicators for gold clearly confirm the bearish outlook. Even though gold moved higher in the last few days, these indicators continue to point to much lower prices in the upcoming days and weeks.
(Click on image to enlarge)
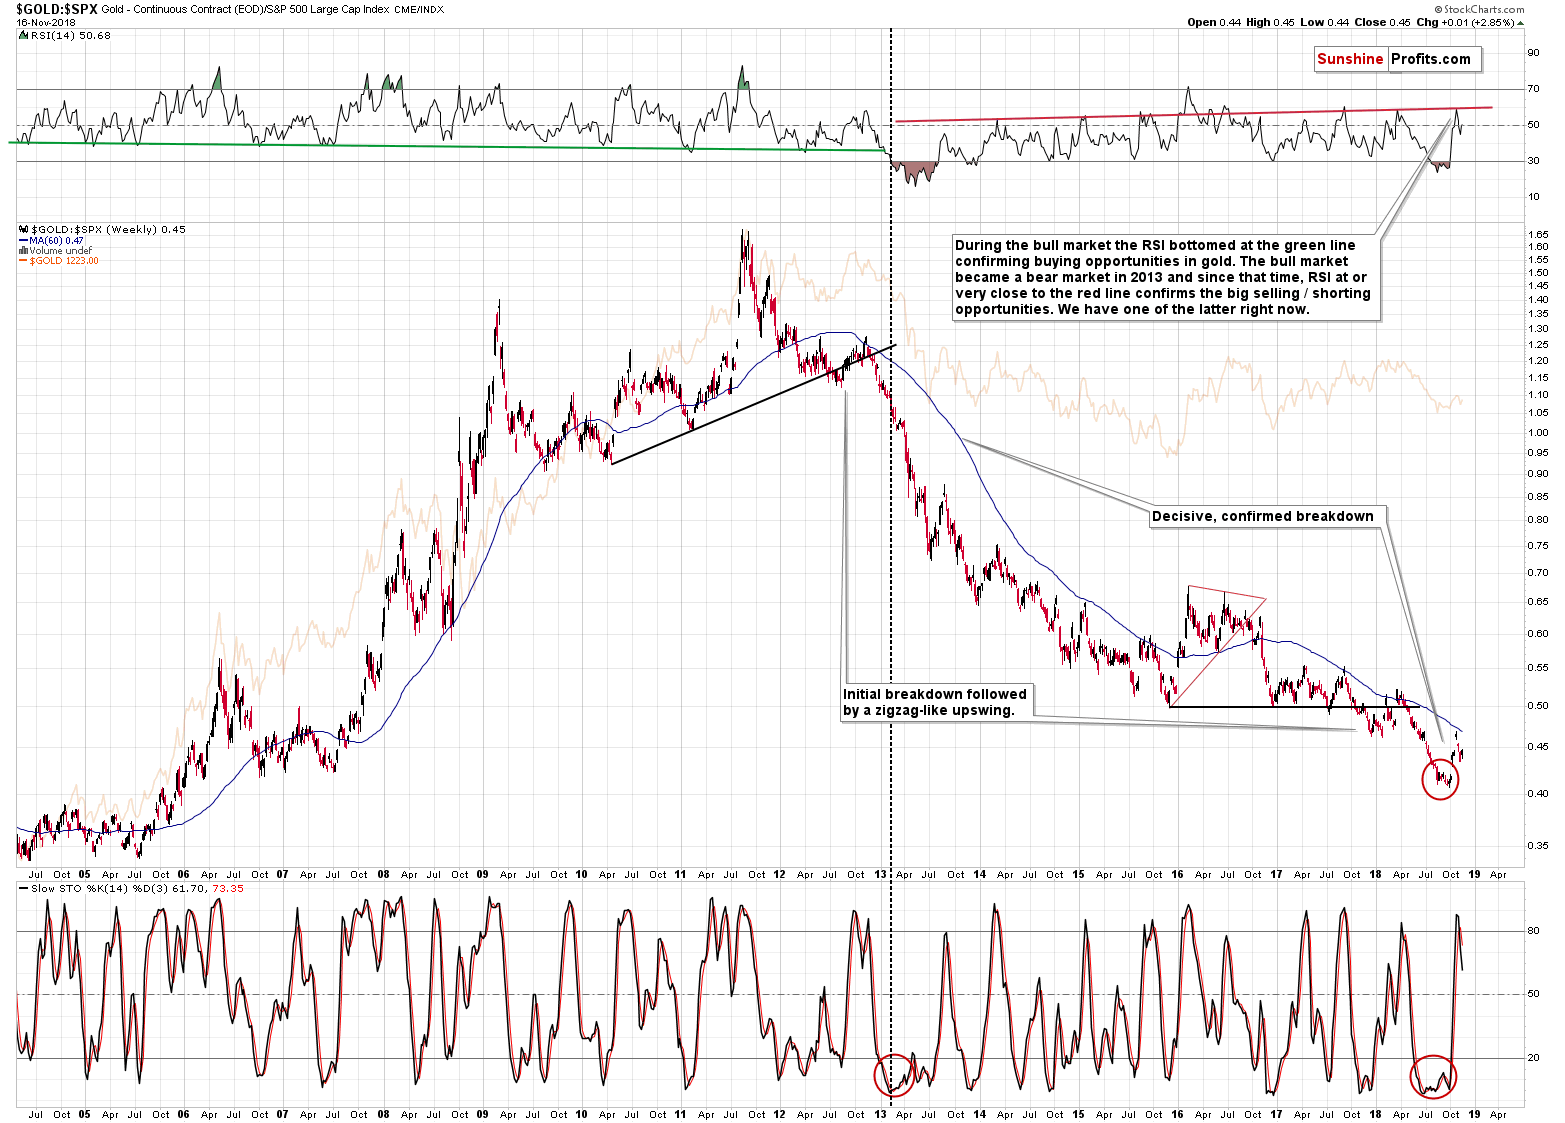
We get the same confirmation from the gold to S&P 500 ratio chart. The ratio moved back to its 60-week moving average, which served as strong resistance several times in the past. The RSI indicator based on the ratio moved to its own resistance as well. Both: ratio and the RSI declined, and it seems that local tops are already in. The Stochastic indicator flashed a clear sell signal confirming the above, which further confirms the bearish outlook for the yellow metal.
(Click on image to enlarge)
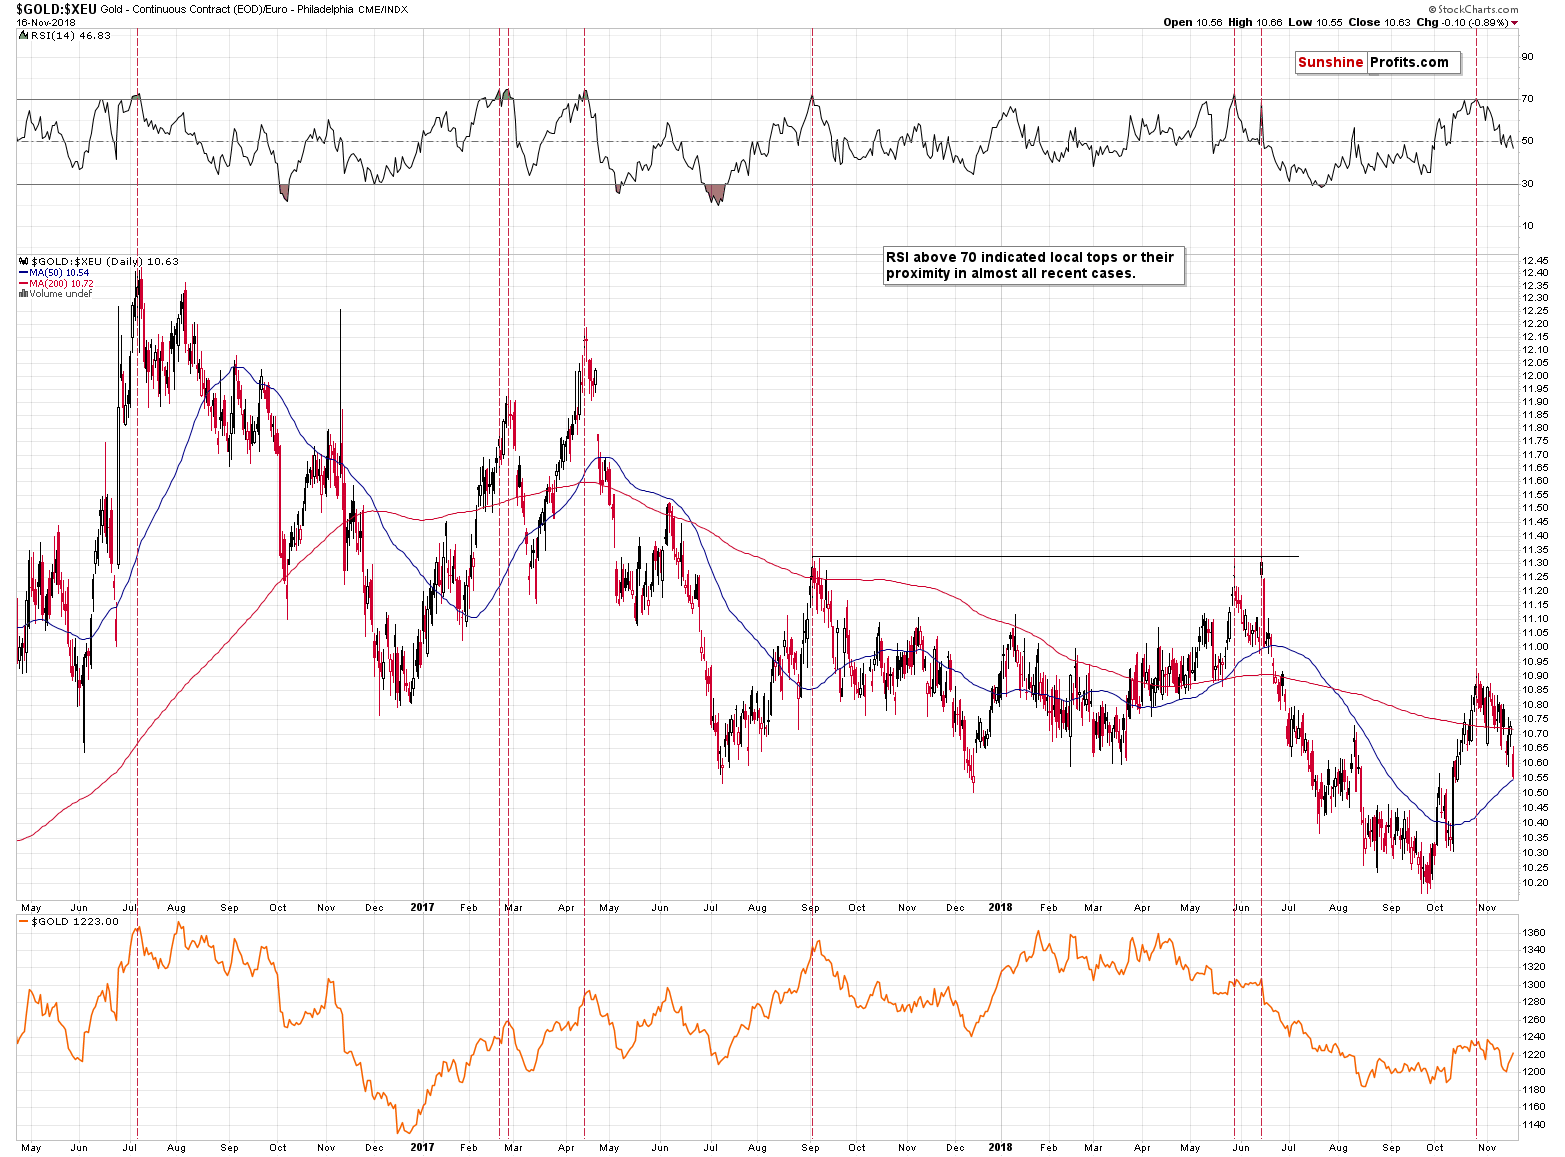
Speaking of gold’s recent price increase, let’s not forget that it was not visible in terms of all currencies. For instance, looking at gold in terms of the euro we see a decisive move lower that followed a clearly confirmed (by the RSI) top.
The bearish indications don’t end with gold.
Silver’s Upcoming Reversal
Let’s start the silver section with white metal’s long-term chart.
(Click on image to enlarge)
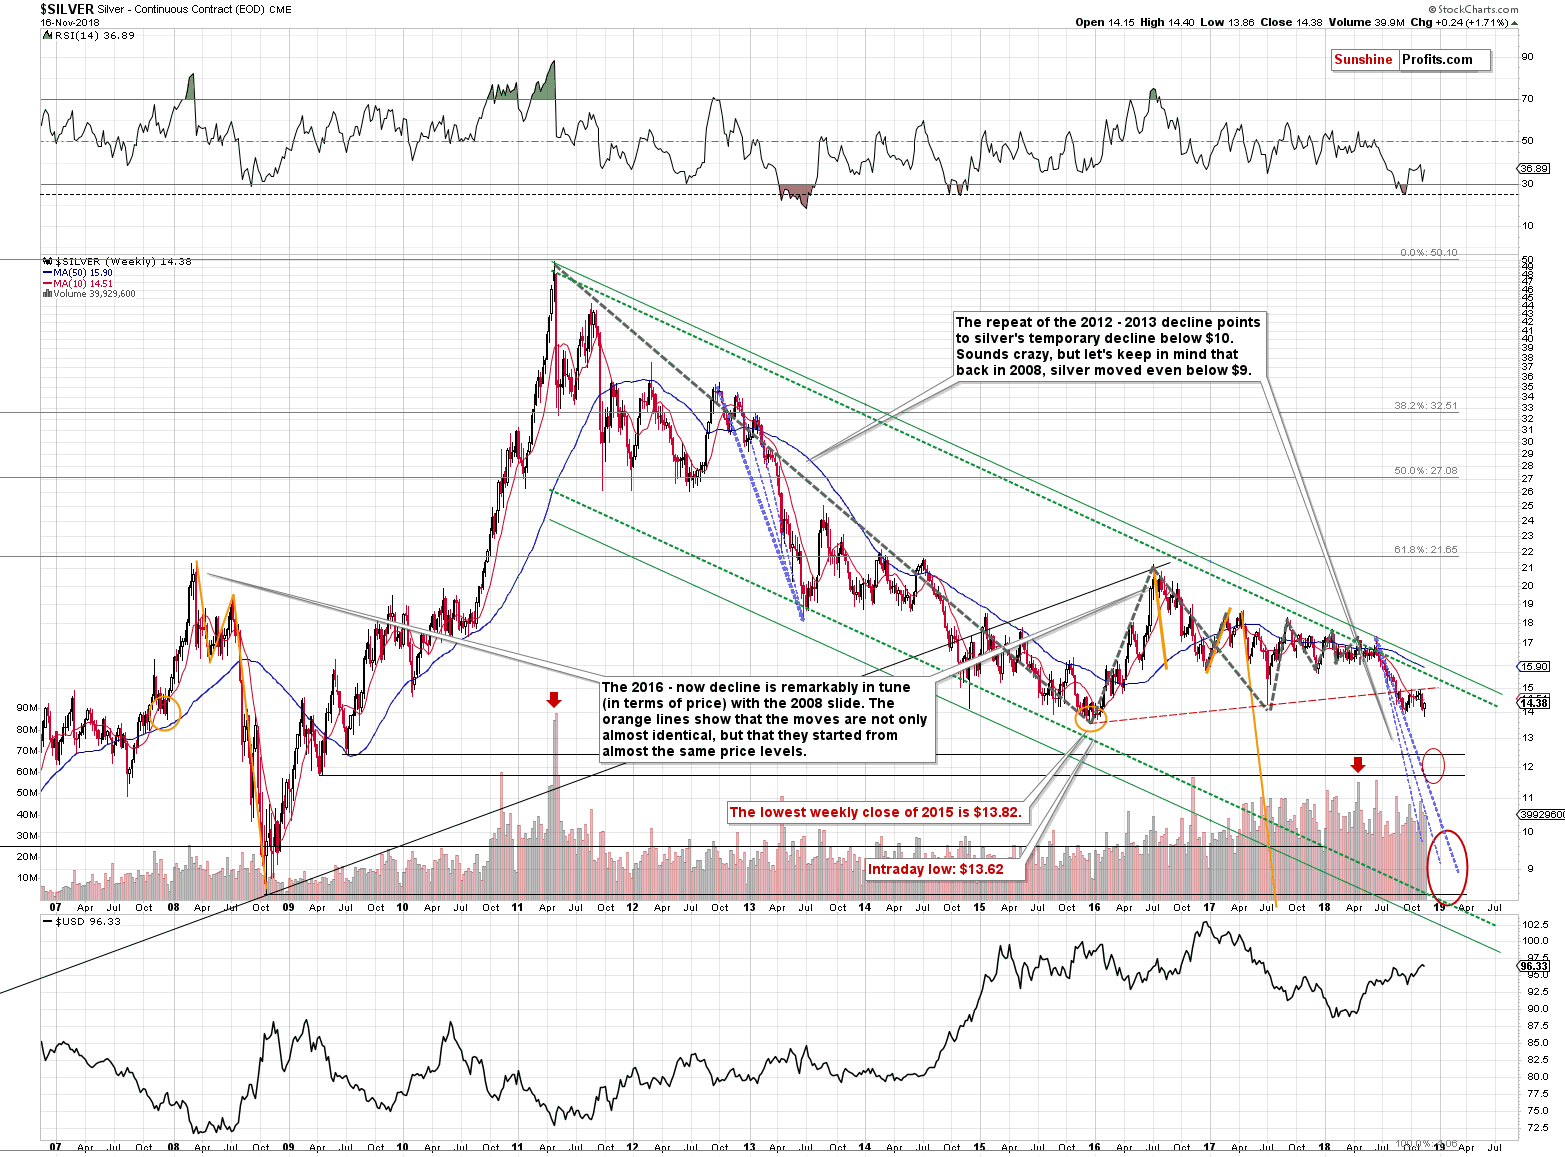
The white metal just reversed after invalidating the breakdown below the previous 2018 bottom, but that’s not the most important thing that we see on this chart. The key thing has been present for months. Namely, silver is after a breakdown below the rising red support line and this breakdown has been more than verified. It was verified by weeks of trading below it and through a temporary moved back to it that didn’t manage to push silver above. That’s exactly how breakdowns should be verified if they are to be followed by a major decline.
Now, if we had just seen an invalidation of the move below the 2015 bottom, it would be an important bullish indication. However, silver didn’t move below the 2015 recently. It only moved below the local 2018 bottom and it was this move that was invalidated. This is a visible, but not extremely strong bullish signal and the fact that the breakdown below the rising medium-term red line was confirmed so clearly is more important.
(Click on image to enlarge)
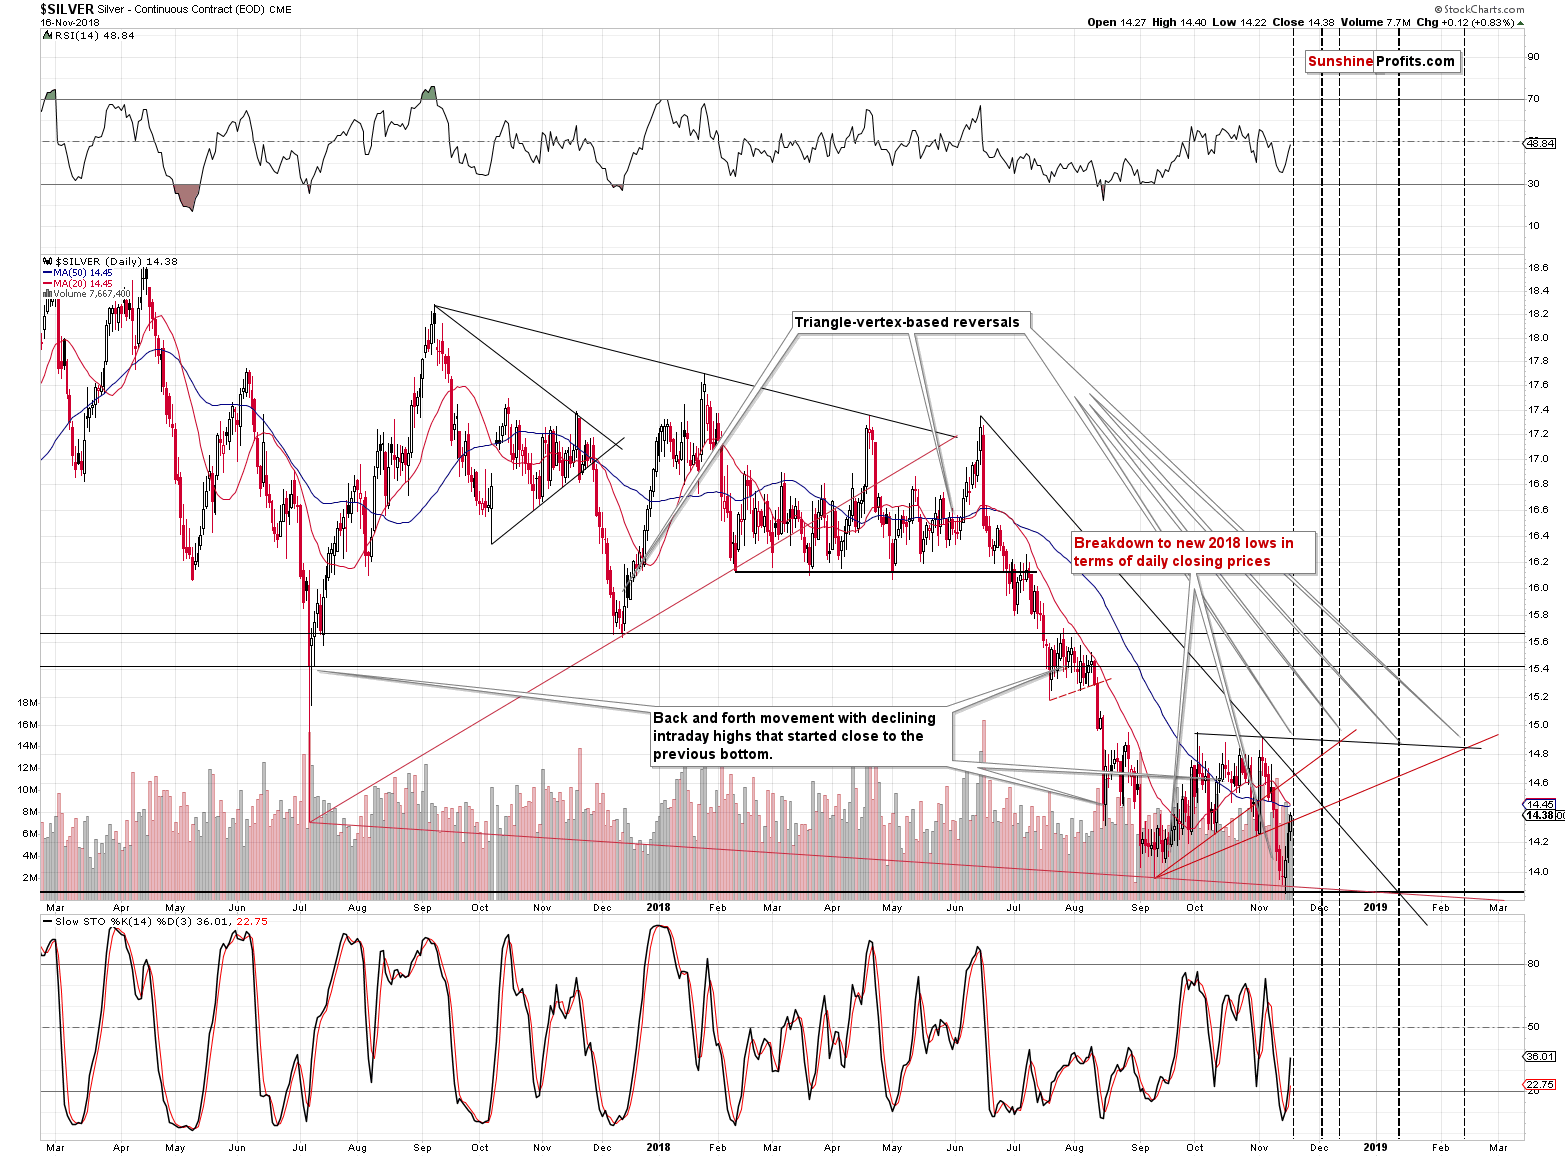
Besides, perhaps it was actually a good thing (speaking from the perspective of someone, who benefits from declining silver prices) that silver moved somewhat higher recently. Silver’s triangle-vertex-based reversal is today. If it wasn’t for the relatively small (didn’t erase the preceding decline) upswing in silver’s price, this reversal would have bearish implications.
Taking the pace at which silver declined recently into account, it seems that it might have coincided with silver’s breakdown below the 2015 bottom and the reversal could have triggered its invalidation. This, in turn, might have led to a powerful weekly or monthly corrective upswing. Since we saw a corrective upswing earlier and the triangle-vertex-based reversal has bearish implications, the outlook is actually more bearish than it would have been if the rally hadn’t taken place.
Moreover, the previous underperformance of silver and its decisive decline (gold and gold stocks didn’t break below its 2018 lows, but silver did) is something that is very much in tune with what happened in 2013 right before the big plunge.
(Click on image to enlarge)
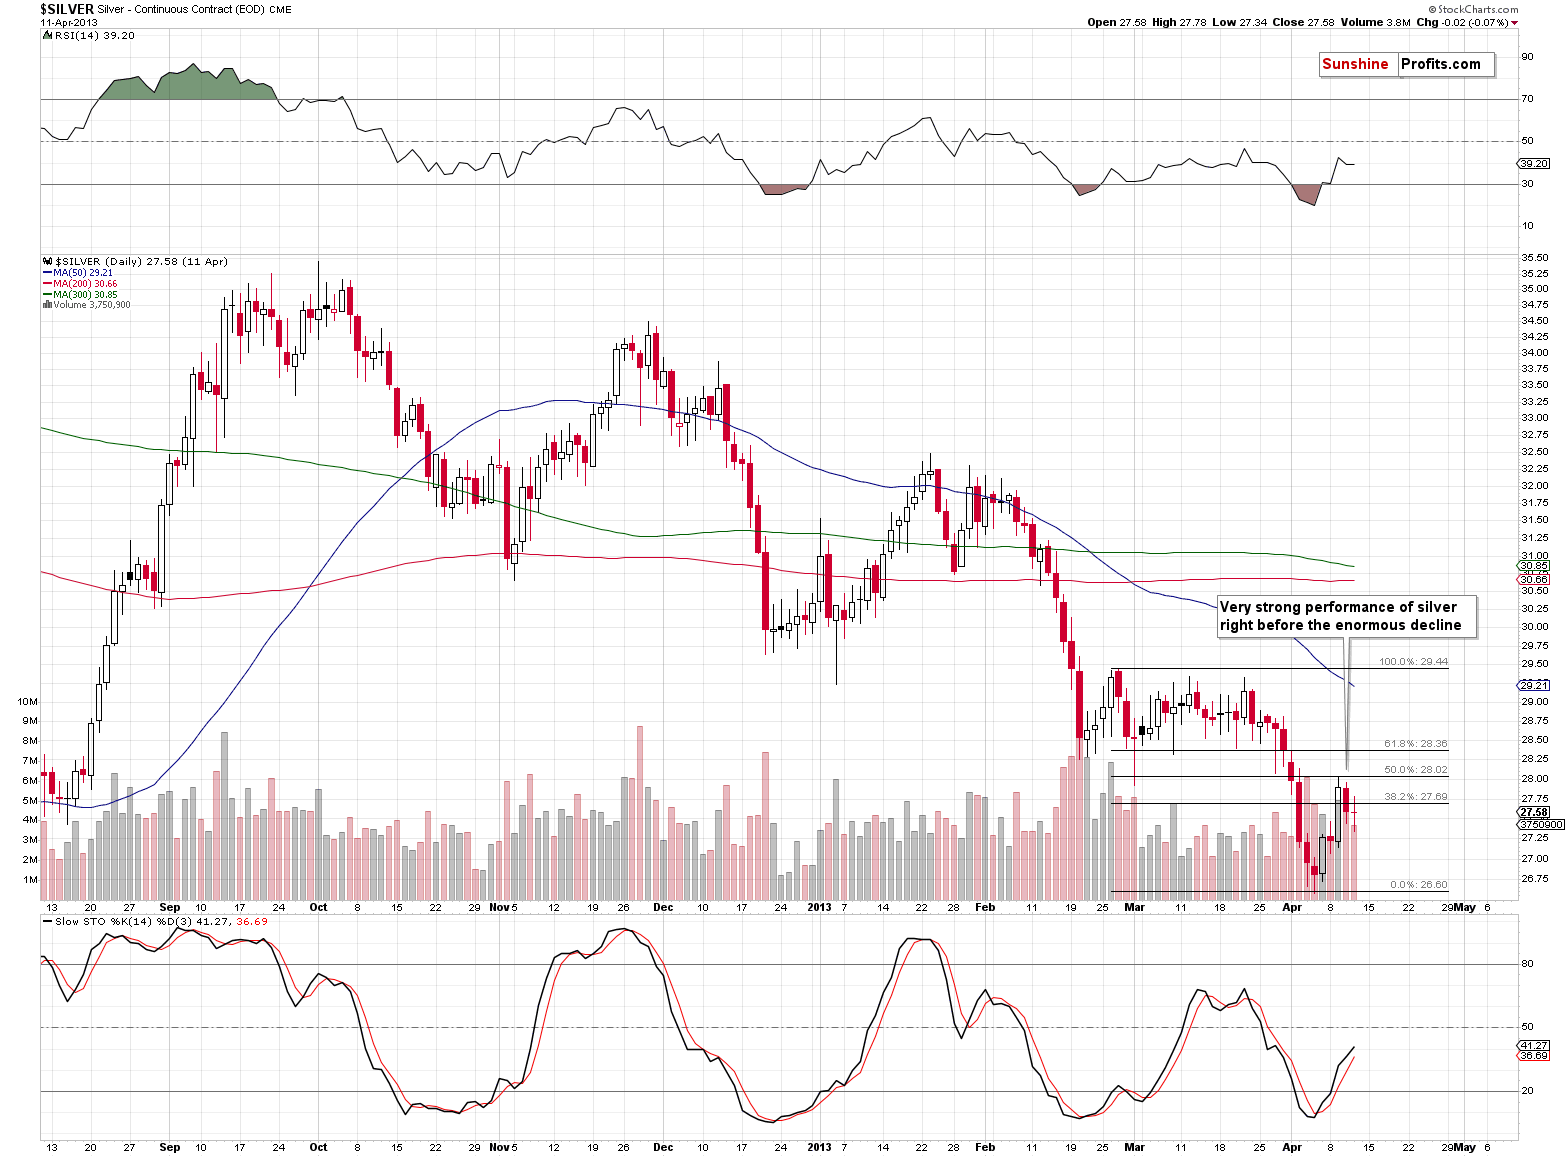
Back then (early April 2013) gold also moved to new lows, but silver’s decline was bigger anyway.
But let’s move a bit further into the past. In February 2013 silver declined significantly, then formed a local bottom, corrected slightly, and declined once again forming a new intraday bottom, but there was no significant move in terms of the closing prices. Then silver moved higher again, but overall we saw a quite boring back-and-forth trading that ended in the final part of March. Silver declined (underperforming gold) and bottomed in early April. It then corrected 50% of the preceding downswing. This correction was the final chance to prepare for the upcoming plunge.
Fast forward – it’s 2018.
(Click on image to enlarge)
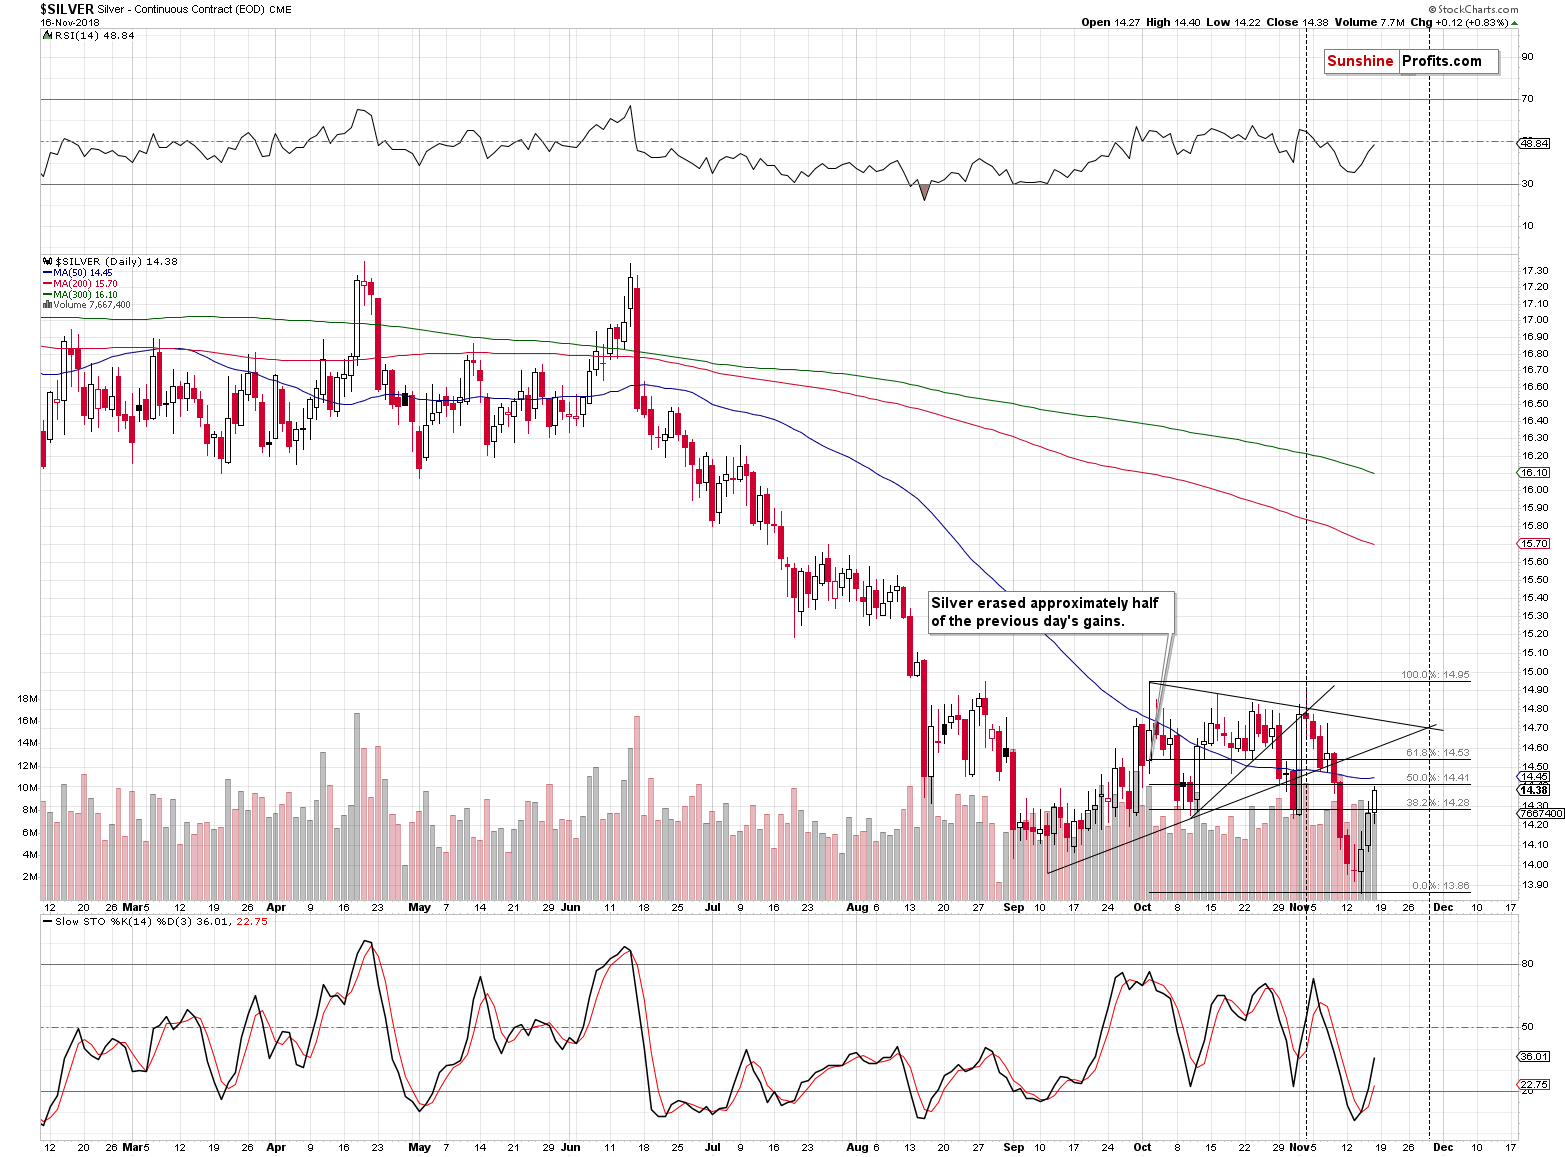
And we can describe the situation on the above chart using the preceding paragraph, while only making tiny adjustments:
In August 2018 (plus the first session of September) silver declined significantly, then formed a local bottom, corrected slightly, and declined once again forming a new intraday bottom (the first half of September), but there was no significant move in terms of the closing prices. Then silver moved higher again, but overall, we saw a quite boring back-and-forth trading that ended in November. Silver declined (underperforming gold) and bottomed in mid-November. It then corrected 50% of the preceding downswing (that was the previous trading session). Back in 2013, this pattern was the final chance to prepare for the upcoming plunge. The same is likely the case today. This is likely the final call.
Miners’ Strong Rally and Its Implications
(Click on image to enlarge)
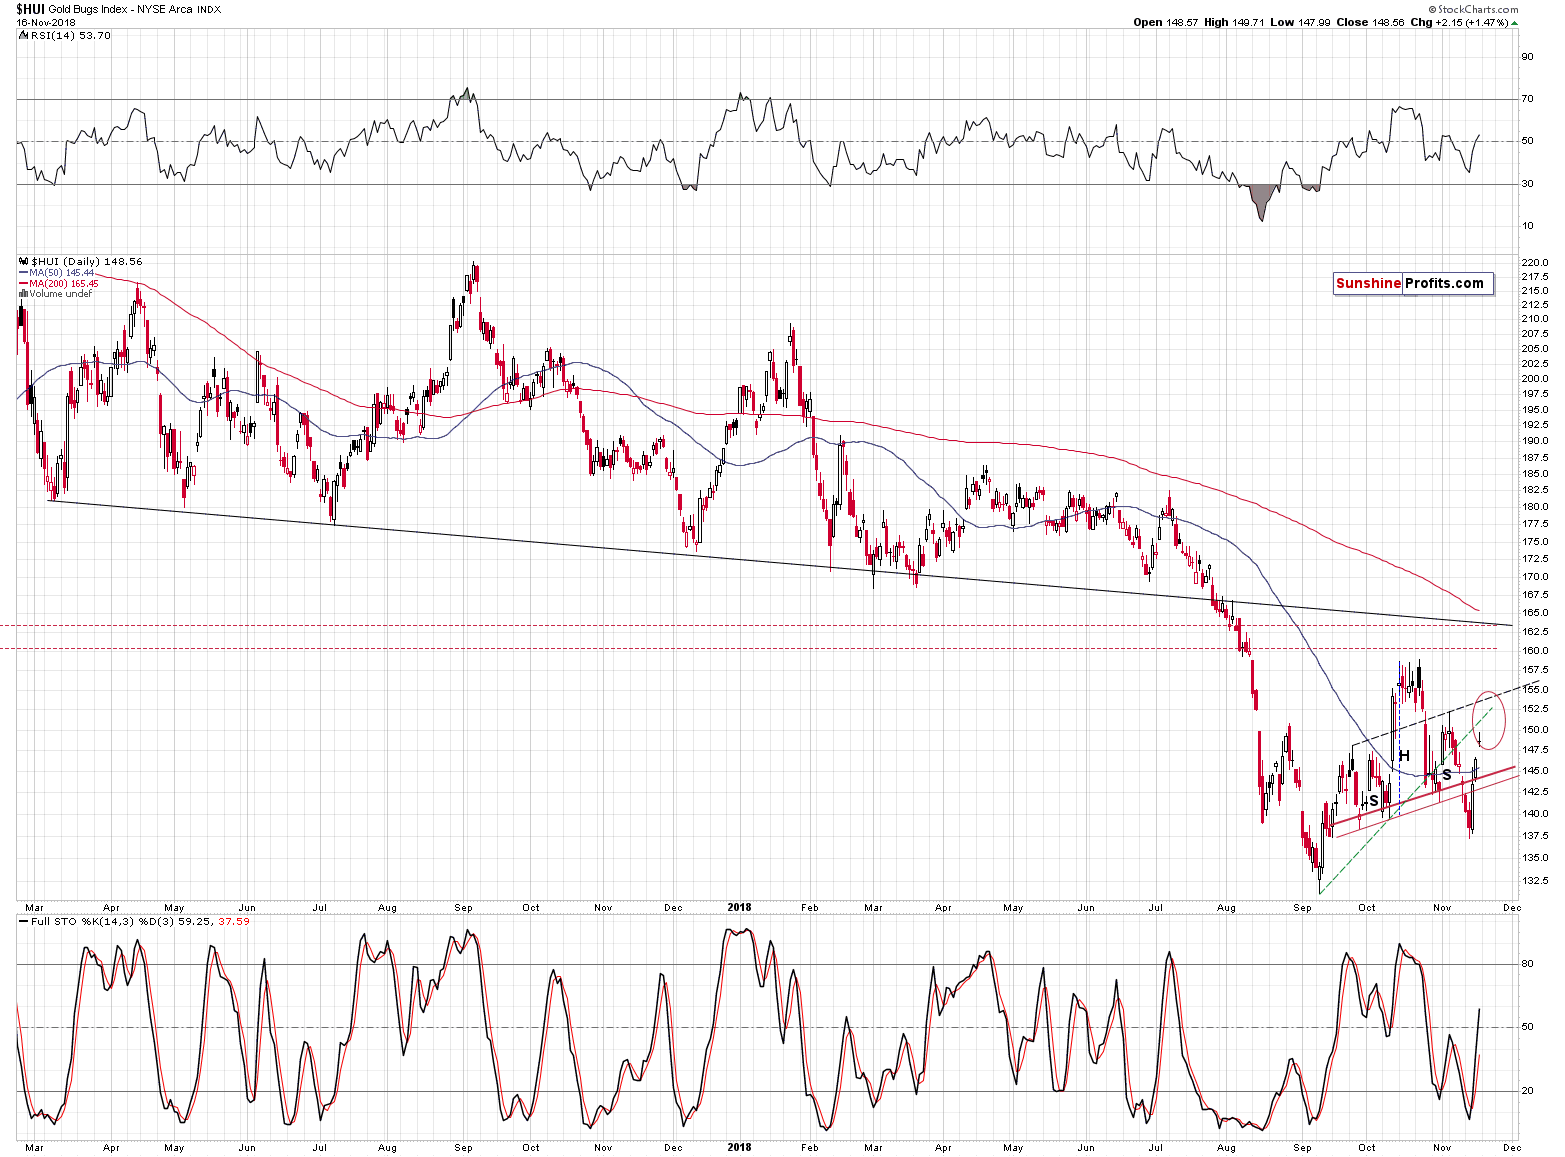
The situation in the mining stocks is not developing in perfect tune with their major downtrend, but within the borders of what one might call reasonable for a downtrend. A local head-and-shoulders formation was invalidated, which was a bullish development for the short term (and only for the short term) and it was followed by higher mining stock prices. What does it imply for the future? It suggests that the rally that was likely to happen based on the invalidation, may have already happened. Moreover, since the miners are approaching their resistance levels, it seems that the upside potential is quite limited.
The gold miners are already in the lower part of their target area. This means that they might have already topped, or that the top will be formed at slightly higher levels. The HUI Index is already at the height of the left shoulder of the previous head-and-shoulders pattern. It might reverse right away, but it might move also to the right shoulder (at about 152.5) or to the rising dashed line that’s based on both above-mentioned shoulders (at about 154).
Gold miners are naturally connected with the price of gold and if gold declined significantly from here, it would be normal to expect the mining stocks to decline. And indeed, we expect both to decline. But does it mean that the bearish outlook for the mining stocks is based only on the outlook for gold? Of course not. One of the things that should be considered is mining stocks’ relative performance to gold.
They just jumped relative to gold, so that’s definitely bullish? No.
In all areas of life, things in excess can easily turn into their opposite. And that seems to be the case here.
Mining Stocks’ Outperformance: The Brightest Flame Burns Quickest
(Click on image to enlarge)
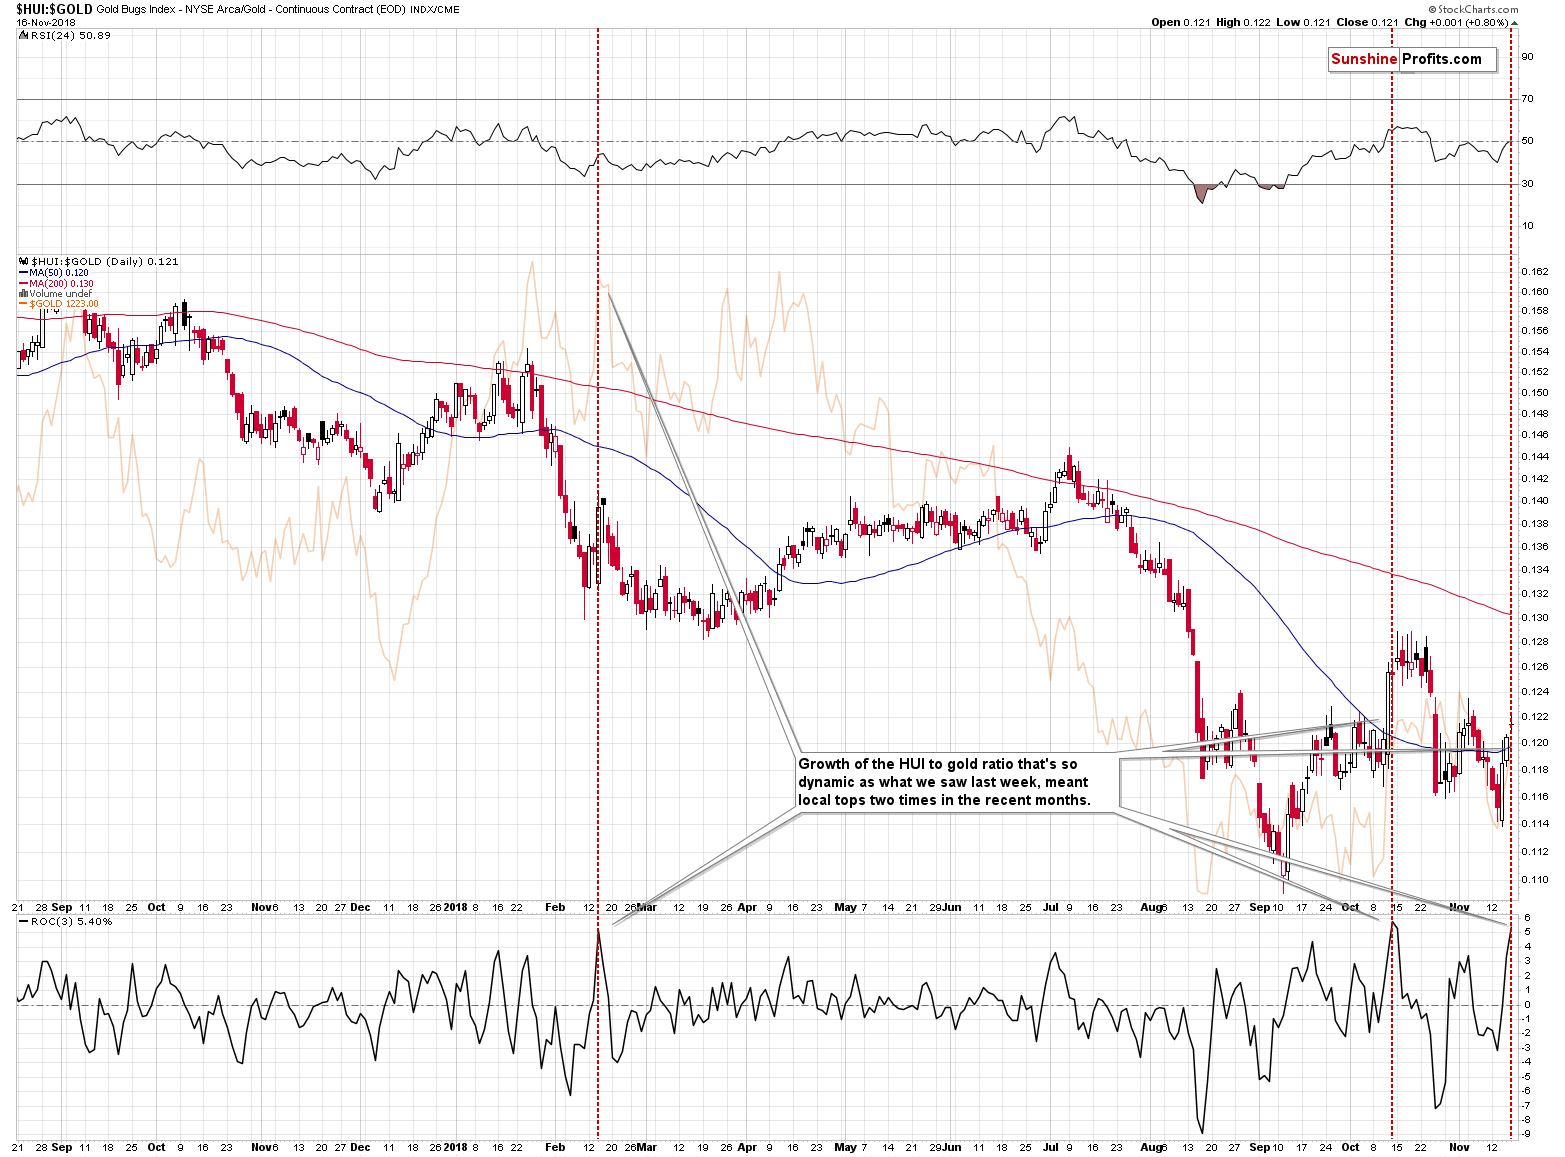
The above chart features the gold stock to gold ratio. It rallied recently and the rally was sharp. Too sharp. The ROC (Rate of Change) indicator in the bottom part of the above chart shows the rapidness of the recent growth in the ratio. In other words, it gives a numerical and comparable value of how fast miners outperformed.
This value moved to its previous extreme and this was the case only two times in the recent past. Once about a month ago, and once in February. What happened next? The orange line in the background of the above chart shows what happened in gold. It moved back and forth for several days and then it declined. The most important thing is that the rally didn’t continue in any significant way. Whether it was the top or not wasn’t that critical. It was critical to close any remaining long positions at that time and at least consider opening short positions. In the absence of other bearish factors, one might have preferred to wait for more bearish confirmations, but at this time we have multiple sell signals in place, many of which are very strong.
In Metallica’s Mama Said song, one of the verses starts with the statement that “the brightest flame burns quickest” and it’s likely that we just saw an example thereof in case of the gold stocks to gold ratio. The rally was too sharp to be sustainable and thus it’s quite likely to end rather sooner than later.
Can Gold Really Drop Despite Its Fundamental Situation?
Yes. The fundamental situation doesn’t determine whether the price will move higher or lower in the short- (definitely) or medium- (mostly) term. One could simultaneously see a decrease in gold prices along with a decline in gold supply, decline in gold inventory, a decrease in gold production cost, and even a temporary boost from a positive safe-haven role of gold in light of new trade war announcements. The very foundation of our gold investment philosophy is to focus on the fundamental factors in order to determine the very long-term outlook for gold (that’s what it is useful for) and then to determine the likely scenarios for the medium and short term using the tools that are useful for it. At this time, the latter provide us with a very bearish gold forecast for the following weeks.
Summary
Summing up, the small corrective upswing that was likely to take place based on the few short-term bullish signals seems to have already taken place – either entirely, or mostly. It seems that we will not have to wait long before the big downswings resumes. And if the likely outcome takes place and the decline is indeed similar to the one from 2013, all this waiting will be extremely well worth it. We may see somewhat higher PM prices in the next few days, but this move is not likely to change anything. The key word here is “may” – the big plunge could take place any day, so we are not adjusting our positions based on the above possibility. The risk to reward ratio continues to favor short positions in gold, silver, and mining stocks because of all the long-term factors that remain in place and that we discussed recently.
Disclaimer: All essays, research, and information found on the Website represent the analyses and opinions of Mr. Radomski and Sunshine Profits' associates only. As such, it may prove wrong ...
more

