
The Frankie Valli, “Can't Take My Eyes Off You” Stock Market (And Sentiment Results)…

The song we chose to embody the sentiment of this week’s stock market is Frankie Valli’s legendary song, “Can’t Take My Eyes Off You.” I grew up in New Jersey, what did you expect?..
You’re just too good to be true
Can’t take my eyes off of you
You’d be like Heaven to touch
I wanna hold you so much
At long last, love has arrived
And I thank God I’m alive
You’re just too good to be true
Can’t take my eyes off of you…
Frankie Valli, "Can't Take My Eyes Off You" (youtube)
We’re in an odd spot. Sentiment is generally euphoric for the indices, but under the surface, the rotation we have anticipated since late summer – continues to perform.
On Friday, I was on “Wall to Wall” with Greta Wall on OAN. We discussed the implications of the Jobs Report. Thanks to Greta for having me on.
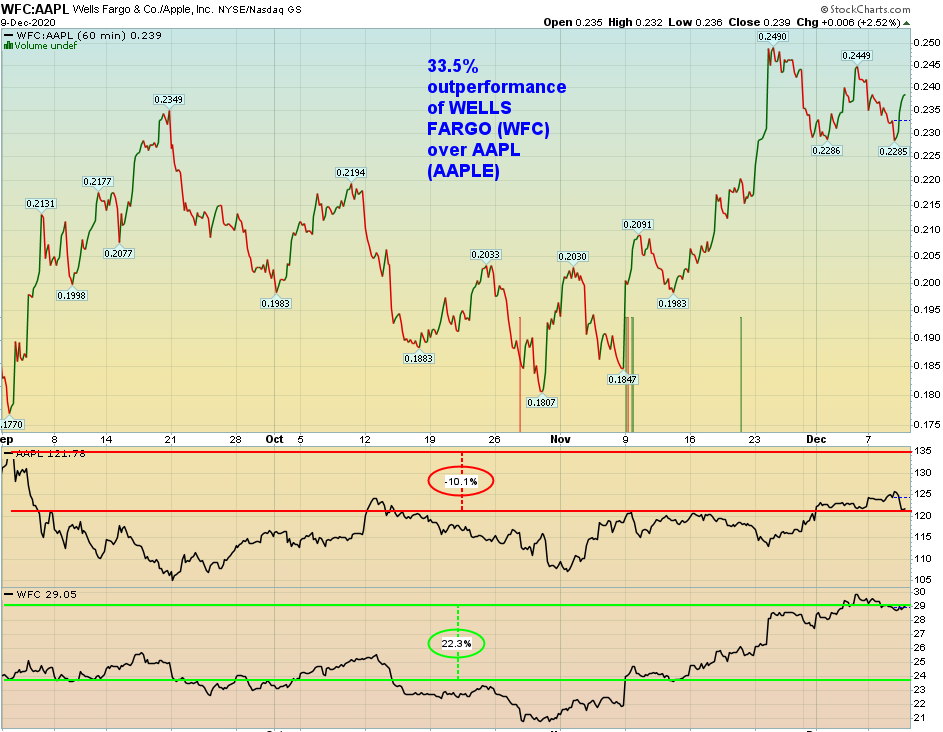
We also discussed what has happened since my last appearance on August 31, when I said that the “Most Hated” stock in the S&P 500 (WFC) would outperform the “Most Loved” stock in the S&P 500 (AAPL) in the following months. Here’s what has happened since:
Tom Hayes - OAN Appearance - VIDEO
On Friday night I was on CGTN America (Global Business) with Sean Callebs. Thanks to Sean and Delal Pektas for having me on.
In this segment we covered the relationship between China’s recovery/economic data and the U.S. We covered recently diverging monetary/fiscal policy and implications moving forward. Also, the impact of potential de-listing of Chinese companies on US Exchanges:
Tom Hayes - CGTN America Appearance - VIDEO
So everyone knows the market is overheated, and everyone’s calling for a pullback. Let’s take a look at some data that can help us discern what to expect on a probabilistic basis:
NYSE Plurality Index
Yesterday I put out the NYSE Plurality Index as our “Indicator of the Day:”
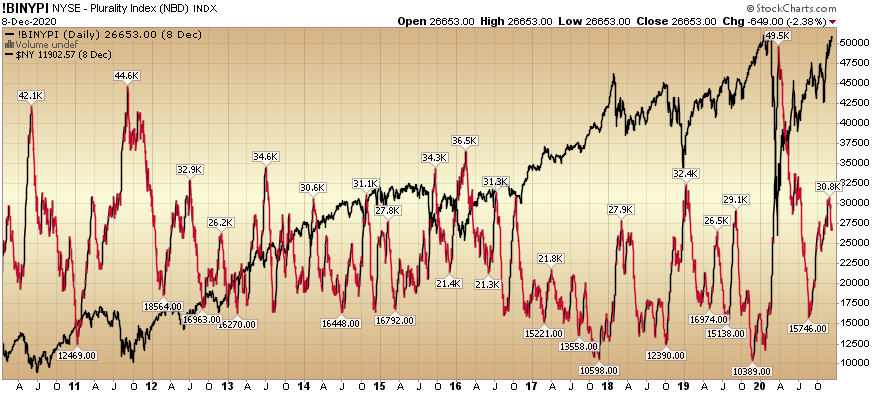
The black line is the NYSE Composite and the red line is the Plurality Index. The Plurality Index is the sum of the absolute values of the difference between the number of advancing and declining issues of the New York Stock Exchange. That sum is calculated for the previous 25 days.
A high number of this indicator is often a sign of an imminent market bottom while a lower number is often a sign of an imminent market top.
The NYSE Composite Index is a float-adjusted market-cap-weighted index which includes all common stocks listed on the NYSE, including ADRs, REITs, and tracking stocks and listings of foreign companies. It is a broader representation of all listed companies relative to other indices.
The odd thing about this read is that the current reading is closer to that found near a market bottom – versus a market top. One of the key reasons we “can’t take our eyes off you (the market)” these days.
Put/Call Ratio
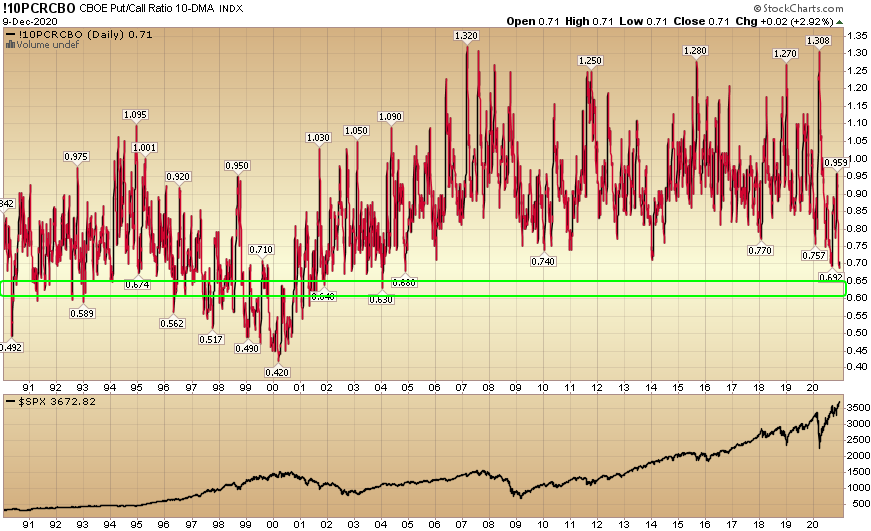
Below I’ve listed the 10-DMA (Day Moving Average) CBOE Put/Call ratio – which many have been pointing to as a reason that we are ready to crash.
While we may get a pullback, they suffer the effects of recency bias. When you look back further to the sweet-spot of the 90’s bull market, these low readings were the “norm”, not the exception. In other words, the market is not yet “bullish enough” from a secular bull market standpoint.
“Extremely Stretched”
Goldman Sachs put out a note calling current Equity Positioning “Extremely Stretched.” @MacroCharts put out a chart measuring that opinion and found that – 4 of 5 times it hit similar levels – the pullback was muted or non-existent: @MacroCharts on Twitter
McClellan Summation Index “Extreme”
Others point to the McClellan Summation Index closing above 1040 as an “extreme” and one more reason the stock market must crash. When you take a step back and view the historical context, it was more often than not a “buy signal” versus a “sell signal.” See Urban Carmel’s chart here: Urban Carmel on Twitter.
Breadth Elevated
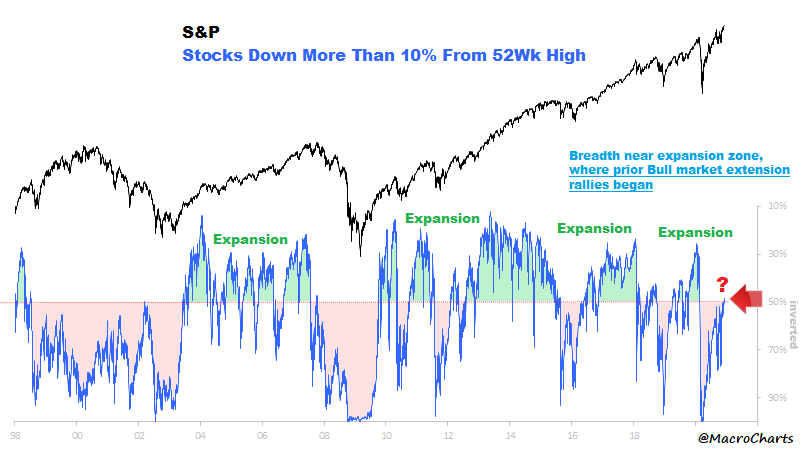
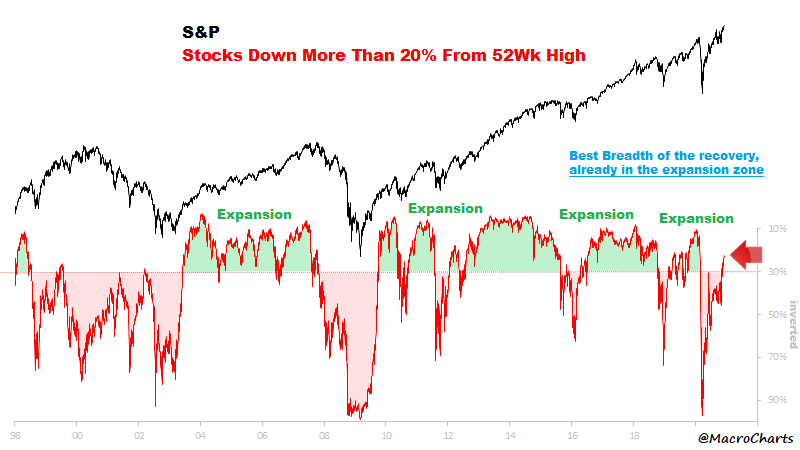
Yet more folks are pointing to “elevated breadth” as the reason we must correct. Again, stepping back a bit further we find current levels sync with the beginnings of an expansion, not the end. @MacroCharts posted these longer view charts on Twitter this week (along with additional commentary):
“Breadth – two important developments;
Less than half of S&P 500 Stocks are down >10% from Highs – near the expansion zone, where prior Bull market extension rallies began.
Just 23% of SPX Stocks are down >20% from Highs – best Breadth of the recovery, already in the expansion zone.”
GDP is NEGATIVE!!!
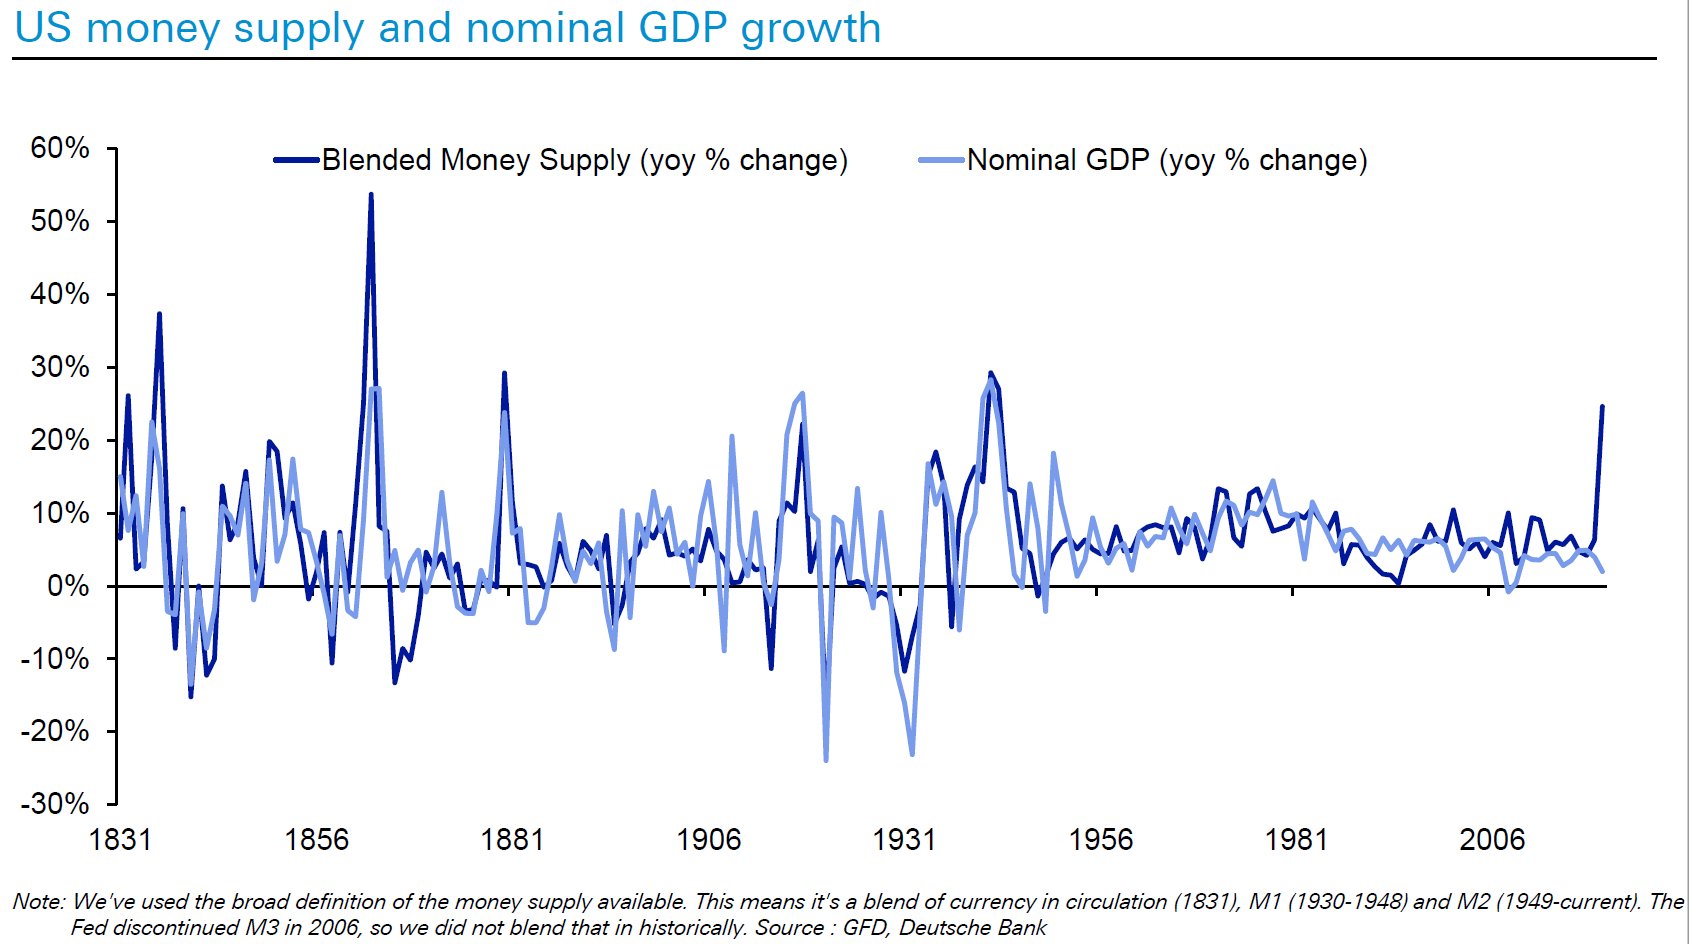
While GDP is set to contract over -3% in 2020, we believe it will grow +5-6% in 2021 – solely as a function of M2 money supply growing ~25% year on year.
Deutsche Bank put out this chart recently, pointing to the fact that the money supply has grown, but not GDP. If you study history, however, you will find the GDP growth FOLLOWS money supply expansion (GDP is a lagging indicator, M2 is the leading indicator).
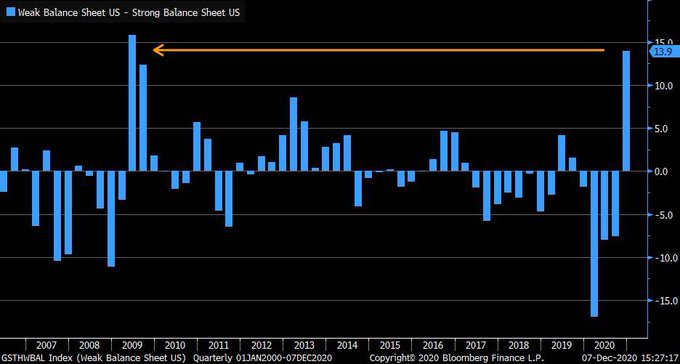
Last Shall Be First
@Bloomberg put out a table this week showing that the companies with the weakest balance sheets were outperforming. Looking back – we can see this same phenomenon in the beginning of the last business cycle – 2009:
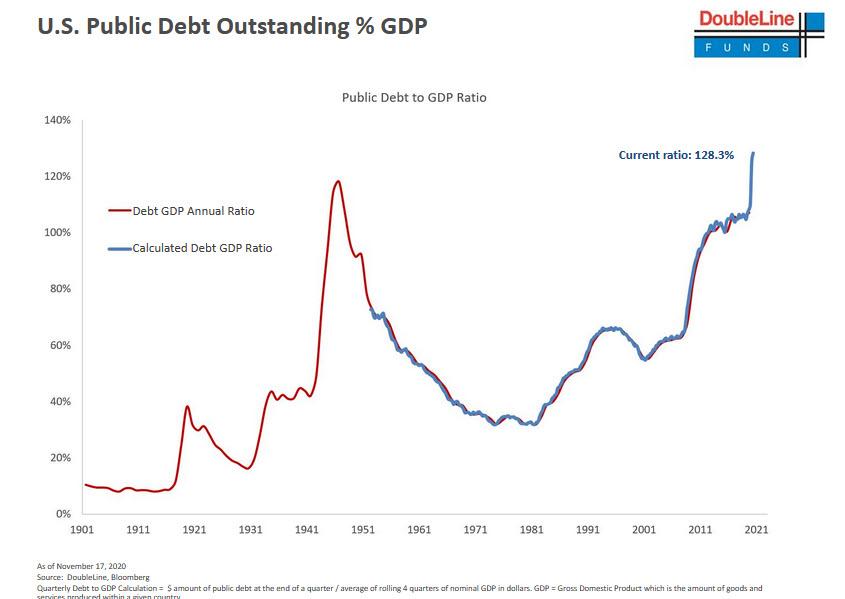
We Have TOO MUCH Debt!
The last time we borrowed this much to fight a war was WWII – when Debt/GDP levels got to ~120%. It was easy to justify because we had a VISIBLE enemy that led to 75M deaths globally. In this war, we have had an INVISIBLE enemy that has lead to ~1.5M deaths globally.
Just as the Debt/GDP levels eroded quickly once the war was concluded (due to economic growth), the same will be true in the coming years. By the mid-1950’s Debt/GDP levels were cut in half to ~60%.
With over $12T of global fiscal stimulus and another ~$8T to central bank liquidity, growth levels will explode once vaccinations are delivered in 1H 2021. The war (against COVID) will be concluded.
Companies Not Buying Back Their Stock!
We often talk about investors having cash on the sidelines (as an impetus to future buying), however, the biggest cash is now on corporate balance sheets.
Barron’s, “In the first three quarters of 2020, share buybacks were down 41%, to $266 billion, over the same period last year, according to data from Wells Fargo strategists.”
“RBC points out that the number of new buyback programs announced by Russell 1000 companies was just above 20 in the most recent data collected for 2020. Precise dates weren’t given. That’s up from just below 20 announcements in the prior reading and up from less than five earlier in 2020 when lockdowns were rampant. The new buyback announcements are nowhere near the lofty levels seen in recent years, as one reading in 2019 showed about 60 Russell 1000 companies announcing buybacks.”
“Companies in the S&P 500 have seen their cash levels rise 36% year to date to roughly $2.54 trillion, up from $1.87 trillion in the fourth quarter of 2019, just before the pandemic. That amounts to a bit more than $5 billion in cash for the average S&P 500 company if it is divided equally.
But companies buy back stock when they have excess cash, not merely a lot of cash. Excess cash in the S&P 500, Wells Fargo says, totals about $1 trillion, or about $2 billion per company, divided equally. S&P 500 operating cash flow — a company’s cash profit from operations minus certain balance-sheet items — has increased 4% in the first three quarters of 2020 over the same period in 2019, according to Wells Fargo. Buybacks are down “even as operating cash flow remained resilient,” Christopher Harvey, Wells Fargo’s head of equity strategy, wrote in a note.
Moving forward, the cash-flow outlook for companies is bright, supporting the share buyback thesis. Free cash flow — a measure of cash flow that subtracts long-term investments like capital expenditures — is expected to rise significantly in 2021. Free cash flow per share is expected to rise 29% in 2021, according to FactSet data.
This is all stock-market-positive.”
Investors Dumping Large-Cap Stocks?
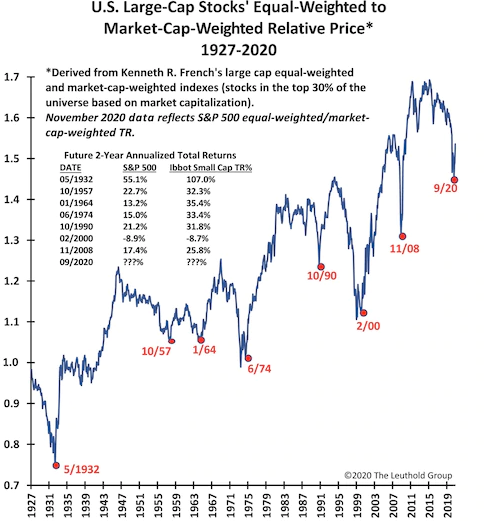
While people see recent weakness in FAANGM (FB, AMZN, AAPL, NFLX, GOOGL, MSFT) as bearish, it’s actually a sign of health for the stock market moving forward. Jim Paulsen of The Leuthold Group laid out the following stats this week (via Business Insider):
- Investors recently started moving cash out of crowded mega-cap stocks and into cyclical.
- The shift makes for a “rare reversal” that’s previously led to outsize gains.
- Market-cap-weighted indexes of large-cap stocks outperformed their equal-weighted peers over the past four years, leading to a historic concentration in a select few tech stocks.
- Only seven previous instances of equal-weighted under-performance have taken place since 1927. Six of them led to reversals that drove double-digit annualized returns over the next 24 months, Paulsen said.
- “Once the equal-weighted index turned around and began to outperform meaningfully, as it has today, it proved to be a wonderful entry point for stock investors,” he added.
Now onto the shorter-term view for the General Market:
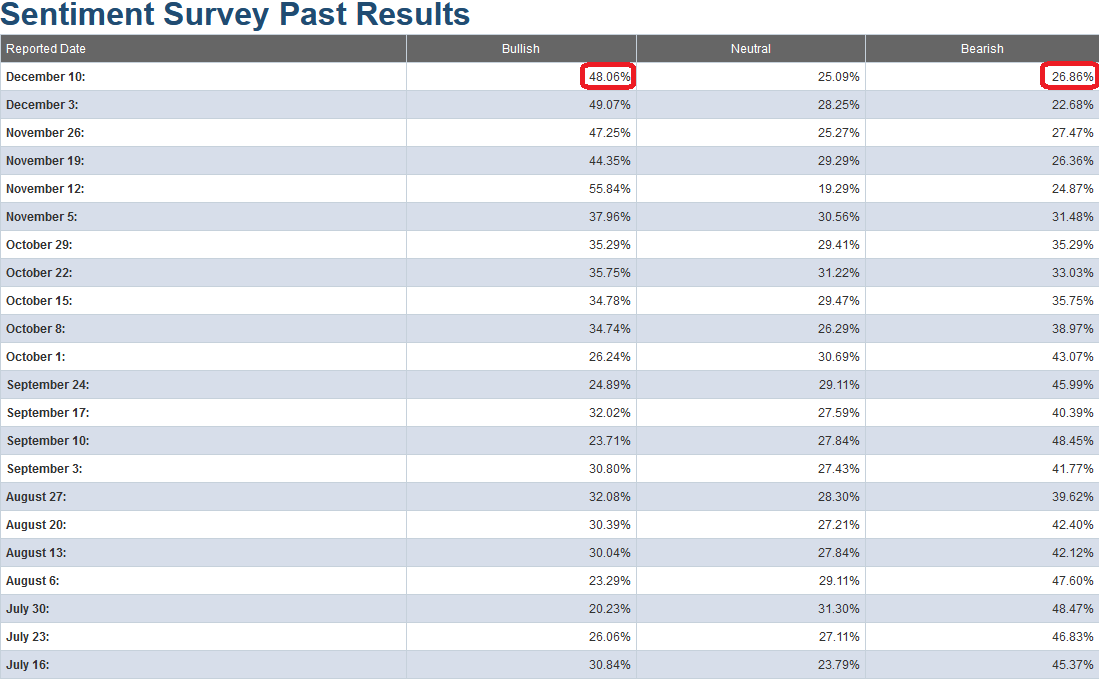
In this week’s AAII Sentiment Survey result, Bullish Percent (Video Explanation) moderated to 48.06% from 49.07% last week. Bearish Percent rose to 26.86% from 22.68% last week. We are still at an extreme in sentiment for retail investors.
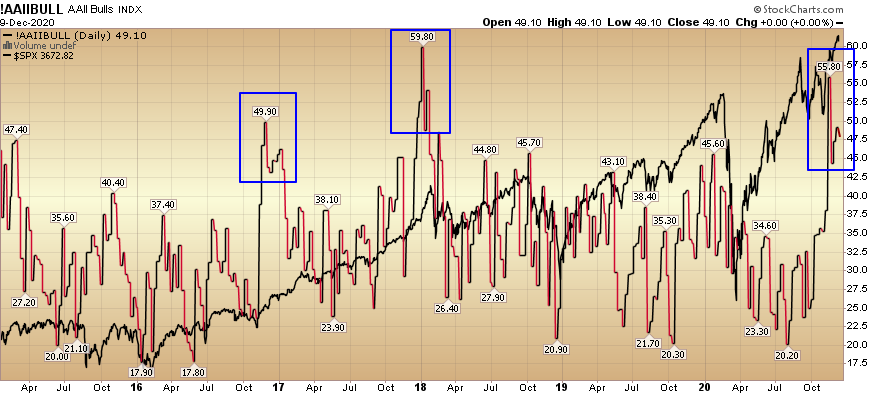
Just like last week – while this is still extreme in short-term sentiment and should be heeded in the short-term – it is important to note in the chart below, that while similar levels presaged a short term top in early 2018, they occurred near the beginning of a longer-term uptrend at the end of 2016-2017 (right after the last Presidential election).
We noted the similarities between the pre-election stock-market in 2016 versus 2020 in our October 29, 2020 note. It has played out exactly according to script ever since, which is why I am inclined to give this extreme level in sentiment the same “benefit of the doubt” as of late 2016. Just like then, most managers were off-sides and flat-footed going into the election and had to panic into the market to play “catch up” before year-end.
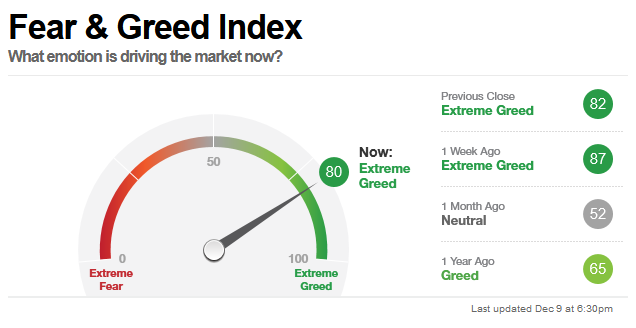
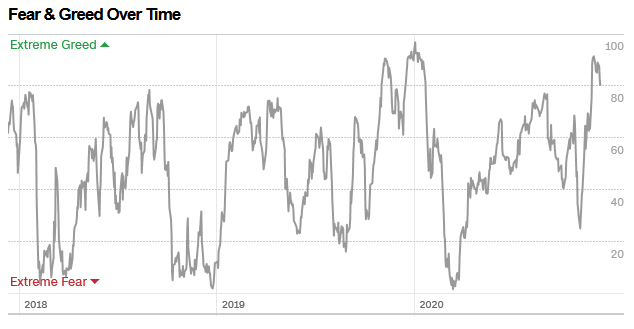
The CNN “Fear and Greed” Index moderated from 87 last week to 80 this week. This is still a euphoric read. This is not where you want to be adding risk to as it relates to the general indices.
It can run hot for a while, but the odds start to stack against you if you are not selective at these levels. You can learn how this indicator is calculated and how it works here: (Video Explanation)
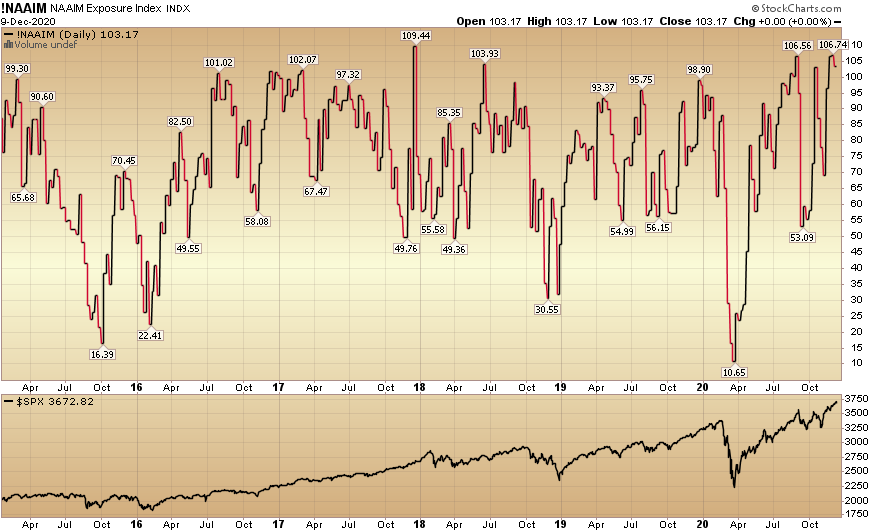
And finally, this week the NAAIM (National Association of Active Investment Managers Index) (Video Explanation) flat-lined at 106.74% this week from 106.41% equity exposure last week. As we said before the election, managers would have to chase into year-end – and they are now doing just that. As you can see over the past five years, this level of extreme warrants caution but is not always indicative of a top.
Our message for this week:
We’ve outlined many of the perceived “negatives” in the market in this week’s note – and were able to debunk MOST of them by just taking a few steps back to look at the longer-term perspective.
For the past few months we have been warning in our notes, “with ominous anti-trust winds swirling around Washington, it may get worse for this small cluster (and several others in the Tech sector) before it gets better. Time will tell…” This was one of the multiple underpinnings of our rotation thesis – which is playing out in real-time.
Our view has stayed consistent:
“While the (short-term) “easy money” has been made in the general indices (since the March lows), I think the easy money is just getting started in “left for dead” sectors/stocks. I believe Banks, Defense Stocks, and pockets of Energy will be as good – if not “orders of magnitude” better (in coming quarters) – than buying the general market in late March.”
So while the market may look, “too good to be true” in the short term, “I want to hold you (stocks) so much” in the intermediate to long term, as the new business cycle has just begun…


