
The Fed Doesn’t Target The Market?
Earlier this month, I penned an article asking if we “really shouldn’t worry about the Fed’s balance sheet?” The question arose from a specific statement made by previous New York Federal Reserve President Bill Dudley:
“Financial types have long had a preoccupation: What will the Federal Reserve do with all the fixed income securities it purchased to help the U.S. economy recover from the last recession? The Fed’s efforts to shrink its holdings have been blamed for various ills, including December’s stock-market swoon. And any new nuance of policy — such as last week’s statement on “balance sheet normalization” — is seen as a really big deal.
I’m amazed and baffled by this. It gets much more attention than it deserves.”
As I noted, there is a specific reason why “financial types” have a preoccupation with the balance sheet.
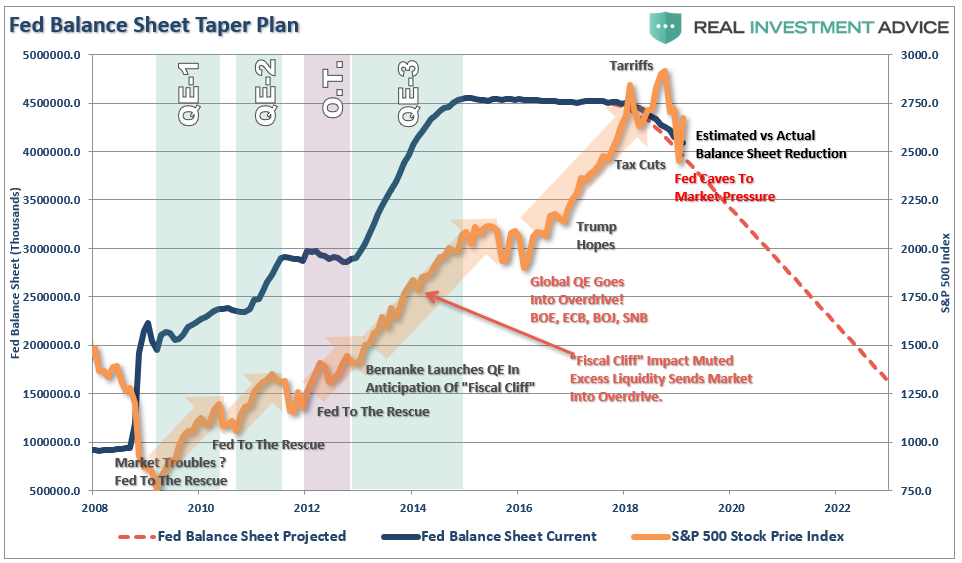
The preoccupation came to light in 2010 when Ben Bernanke added the “third mandate” to the Fed – the creation of the “wealth effect.”
“This approach eased financial conditions in the past and, so far, looks to be effective again. Stock prices rose and long-term interest rates fell when investors began to anticipate this additional action. Easier financial conditions will promote economic growth. For example, lower mortgage rates will make housing more affordable and allow more homeowners to refinance. Lower corporate bond rates will encourage investment. And higher stock prices will boost consumer wealth and help increase confidence, which can also spur spending. Increased spending will lead to higher incomes and profits that, in a virtuous circle, will further support economic expansion.”
– Ben Bernanke, Washington Post Op-Ed, November, 2010.
As he noted, the Fed specifically targeted asset prices to boost consumer confidence. Given that consumption makes up roughly 70% of economic growth in the U.S., it makes sense. So, not surprisingly, when the economy begins to show signs of deterioration, the Fed acts to offset that weakness.
This is why the slowdown in global growth became an important factor behind the central bank’s decision to put plans for interest rate increases on hold. That comment was made by Federal Reserve Vice Chairman Richard Clarida during a question-and-answer session last week.
“The reality is that the global economy is slowing. You’ve got negative growth in Italy, Germany may just grow…1% this year, [and] a slowdown in China. These are all things that we need to factor in.
Slower global growth would crimp U.S. exports and could also negatively influence financial and asset markets, a primary transmission mechanism for monetary policy.”
As we noted previously in “Data or Markets,” the Fed is not truly just “data dependent.” They are, in many ways, co-dependent on each other. A strongly rising market allows the Fed to raise rates and reduce accommodative as higher asset prices support confidence. However, that “leeway” is quickly reduced when asset prices reverse. This has been the Fed cycle for the last 40-years.
The problem for the Fed is they have now become “liquidity trapped.”
What is that? Here is the definition:
“A liquidity trap is a situation described in Keynesian economics in which injections of cash into the private banking system by a central bank fail to lower interest rates and hence fail to stimulate economic growth. A liquidity trap is caused when people hoard cash because they expect an adverse event such as deflation, insufficient aggregate demand, or war. Signature characteristics of a liquidity trap are short-term interest rates that are near zero and fluctuations in the monetary base that fail to translate into fluctuations in general price levels.”
The chart below shows the correlation between the decline of GDP and the Fed Funds rate.
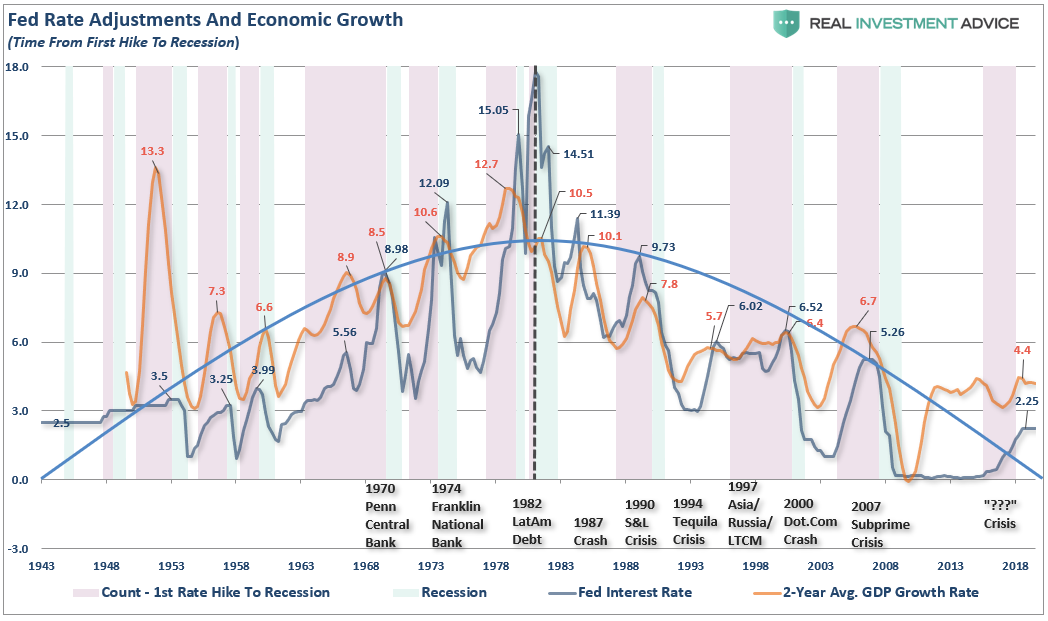
There are two important things to notice from the chart above. The first is that prior to 1980, the trend of both economic growth and the Fed Funds rate were rising. Then, post-1980, as then Fed Chairman Paul Volker and President Ronald Reagan set out to break the back of inflation, each successive cycle of rate increases were started from a level lower than the previous cycle.
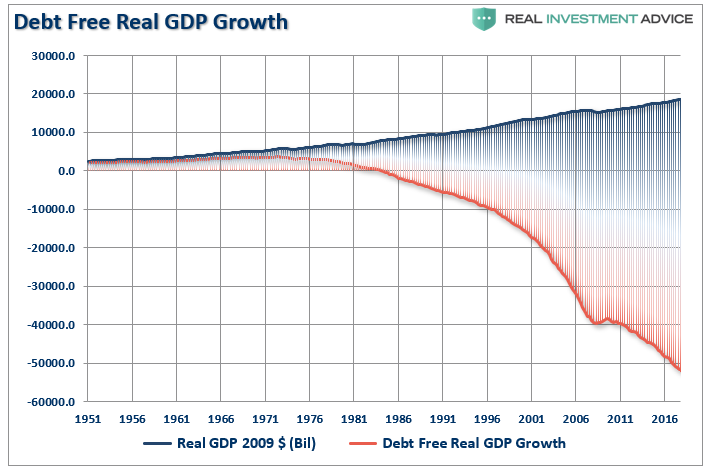
The difference between the two periods was the amount of debt in the system and the shift from an expansive production and manufacturing based economy to one driven primarily by services which have a substantially lower multiplier effect. Since 1980, it has required increasing levels of debt to manufacture $1 of GDP growth.
In every case, the rate cycle increase ALWAYS led to either a recession, bear market, crisis, or all three. Importantly, those events occurred not when the Fed STARTED hiking rates, but when they recognized that their tightening process was confronted by weakening economic growth.
The Trap
The problem for the Fed is that while lower interest rates may help spur economic growth in the short-term, the growth has come from an increasing level of debt accumulation. Therefore, the economy cannot withstand a reversal of those rates. As shown above, each successive round of rate increases was never able to achieve a rate higher than the previous peak. For example, in 2007, the Fed Funds rate was roughly 5% when the Fed started lowering rates to combat the financial crisis. Today, if the Fed started lowering rates to combat economic weakness, they would do so from less than half that previous rate.
As Richard Clarida noted in his speech, one of the potential risks to Central Banks globally is the lack of monetary policy firepower available. We previously pointed out that in 2009, the Fed went to work to rescue the economy with a $915 billion balance sheet and Fed Funds at 4.2%. Today, that balance sheet remains above $4 trillion and rates are at 2.5%.
It isn’t lost on the Fed that if a recession were to occur, their main lever for stimulating economic activity, interest rate reductions, will have little value. Given the amount of debt outstanding and the onerous burden of servicing it, the marginal benefit of lower rates will likely not be enough to lift the country out of a recession. In such a tough situation the next lever at their disposal is increasing their balance sheet and flooding the markets with liquidity via QE.
However, even that may not be enough as both Ben Bernanke and Janet Yellen have acknowledged that they were aware that each successive round of QE was somewhat less effective than the last. That certainly must be a concern for Powell if he is called upon to re-engage QE in a recession or another economic crisis.
For the Federal Reserve, they are now caught in the same “liquidity trap” that has been the history of Japan for the last three decades. One only needs to look at Japan for an understanding that QE, low-interest rate policies, and expansion of debt have done little economically. Take a look at the chart below which shows the expansion of the BOJ assets versus the growth of GDP and levels of interest rates.
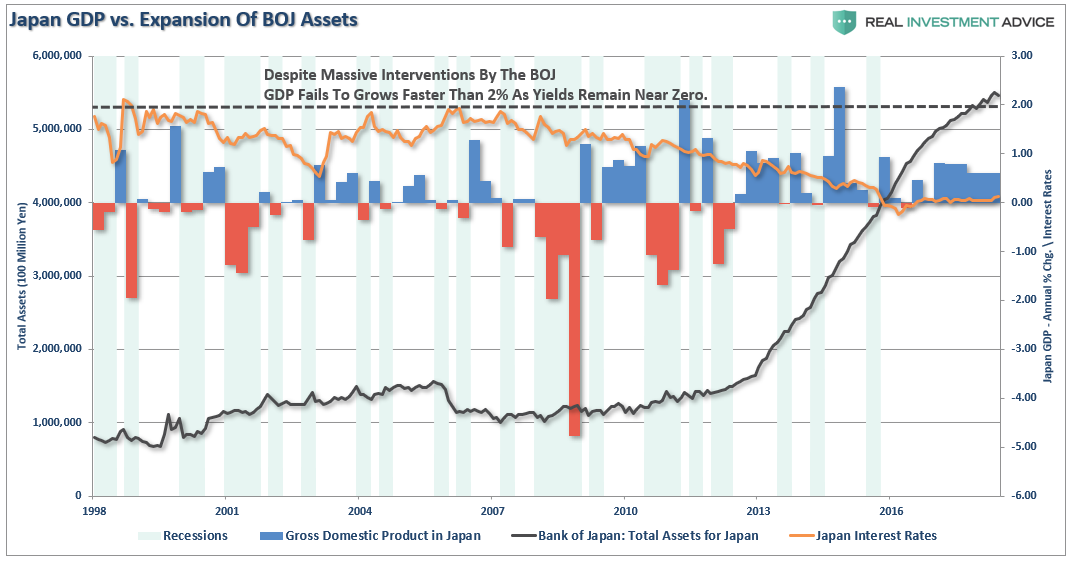
Notice that since 1998, Japan has not achieved a 2% rate of economic growth. Even with interest rates still near zero, economic growth remains mired below one-percent, providing little evidence to support the idea that inflating asset prices by buying assets leads to stronger economic outcomes.
But yet, the current Administration believes our outcome will be different.
With the current economic recovery already pushing the long end of the economic cycle, the risk is rising that the next economic downturn is closer than not. The danger is that the Federal Reserve is now potentially trapped with an inability to use monetary policy tools to offset the next economic decline when it occurs.
This is the same problem that Japan has wrestled with for the last 30-years. While Japan has entered into an unprecedented stimulus program (on a relative basis twice as large as the U.S. on an economy 1/3 the size) there is no guarantee that such a program will result in the desired effect of pulling the Japanese economy out of its 30-year deflationary cycle. The problems that face Japan are similar to what we are currently witnessing in the U.S.:
- A decline in savings rates to extremely low levels which depletes productive investments
- An aging demographic that is top heavy and drawing on social benefits at an advancing rate.
- A heavily indebted economy with debt/GDP ratios above 100%.
- A decline in exports due to a weak global economic environment.
- Slowing domestic economic growth rates.
- An underemployed younger demographic.
- An inelastic supply-demand curve
- Weak industrial production
- Dependence on productivity increases to offset reduced employment
The real concern for investors and individuals is the actual economy. We are likely experiencing more than just a ‘soft patch’ currently despite the mainstream analysts’ rhetoric to the contrary. There is clearly something amiss within the economic landscape and the ongoing decline of inflationary pressures longer term is likely telling us just that. The big question for the Fed is how to get out of the ‘liquidity trap’ they have gotten themselves into without cratering the economy, and the financial markets, in the process.
The One Thing
However, the one statement, which is arguably the most important for investors, is what Bill Dudley stated relative to the size of the balance sheet and it uses a tool to stem the next decline.
“The balance sheet tool becomes relevant only if the economy falters badly and the Fed needs more ammunition.”
In other words, it will likely require a substantially larger correction than what we have just seen to bring “QE” back into the game. Unfortunately, as I laid out in “Why Another 50% Correction Is Possible,” the ingredients for a “mean-reverting” event are all in place.
“What causes the next correction is always unknown until after the fact. However, there are ample warnings that suggest the current cycle may be closer to its inevitable conclusion than many currently believe. There are many factors that can, and will, contribute to the eventual correction which will ‘feed’ on the unwinding of excessive exuberance, valuations, leverage, and deviations from long-term averages.
The biggest risk to investors currently is the magnitude of the next retracement. As shown below the range of potential reversions runs from 36% to more than 54%.”
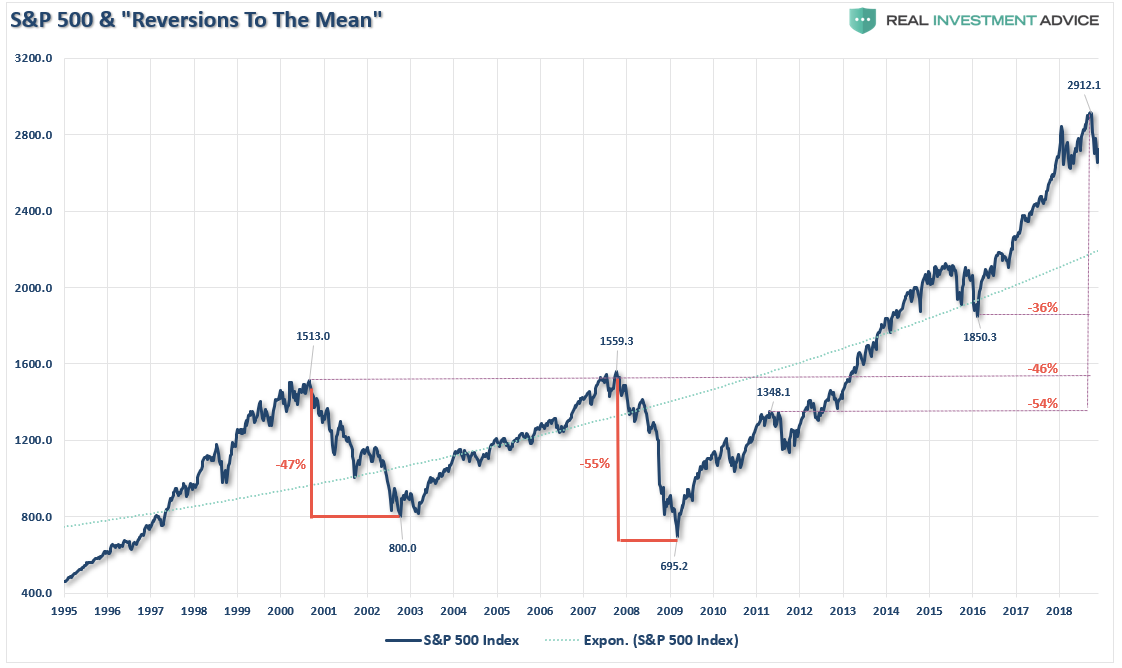
“It’s happened twice before in the last 20 years and with less debt, less leverage, and better-funded pension plans.
More importantly, notice all three previous corrections, including the 2015-2016 correction which was stopped short by Central Banks, all started from deviations above the long-term exponential trend line. The current deviation above that long-term trend is the largest in history which suggests that a mean reversion will be large as well.
It is unlikely that a 50-61.8% correction would happen outside of the onset of a recession. But considering we are already pushing the longest economic growth cycle in modern American history, such a risk which should not be ignored.”
While Bill makes the point that “QE” is available as a tool, it won’t likely be used until AFTER the Fed lowers interest rates back to the zero-bound. Which means that by the time “QE” comes to the fore, the damage to investors will likely be much more severe than currently contemplated.
Yes, the Fed absolutely targets the financial markets with their policies. The only question will be what “rabbit” they pull out of their hat if it doesn’t work next time?
I am not sure even they know.


